
Descrizione
Cos'è un indicatore “Initial Range”?
Questo indicatore è una versione adattata di uno strumento Pine Script chiamato “Opening Range Breakout”.
Originariamente si chiamava ORB – Opening Range Breakout: si prende l'intervallo di prezzo dei primi minuti di una sessione, quindi si opera sul breakout di quell'intervallo.
In questa versione lo abbiamo rinominato in IR – Initial Range, ma l'idea è la stessa:
- L'indicatore costruisce diversi Initial Ranges:
-
- IR5 – primi 5 minuti
- IR15 – primi 15 minuti
- IR30 – primi 30 minuti
- IR60 – primi 60 minuti
- Per ogni IR hai:
-
- IR High
- IR Low
- IR Mid (il punto medio dell'intervallo)
- Puoi scegliere quali intervalli sono attivi e quali colori utilizzano.
Una volta completato un intervallo, l'indicatore cerca il breakout del prezzo da esso:
- Rottura sopra l'IR High → IR60 LONG, IR30 LONG, ecc.
- Rottura sotto l'IR Low → IR60 SHORT, IR30 SHORT, ecc.
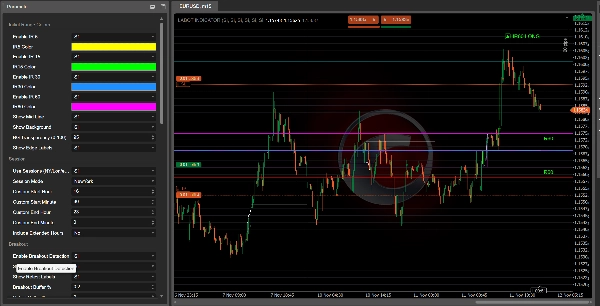
Queste etichette appaiono sul grafico così puoi vedere rapidamente quale intervallo iniziale ha prodotto il segnale.
Filtri e conferme
L'indicatore è progettato per evitare breakout casuali combinando diversi filtri:
- Filtro di trend
Puoi usare: -
- VWAP
- EMA
- Lunghezza EMA personalizzata
- VWAP + EMA insieme
I breakout nella direzione del trend sono favoriti (per esempio, LONG solo quando il prezzo è sopra VWAP/EMA).
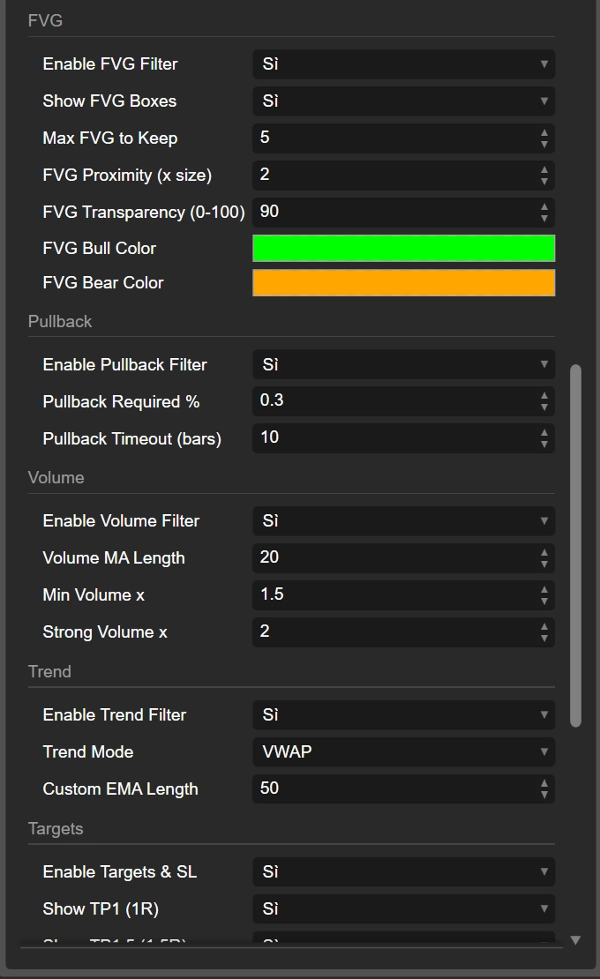
- Filtro di volume
L'indicatore confronta il volume attuale con una media mobile del volume: -
- conferma “normale”
- volume “forte”
I breakout con volume debole possono essere ignorati se lo desideri.
- Filtro FVG (Fair Value Gap)
Rileva FVG rialzisti e ribassisti e può richiedere che il breakout avvenga vicino a un FVG rilevante: -
- FVG rialzista vicino all'IR High supporta LONG
- FVG ribassista vicino all'IR Low supporta SHORT
- Filtro pullback
Puoi richiedere un pullback minimo dopo il breakout e una finestra temporale (in barre) per far avvenire quel pullback. Questo ti aiuta a concentrarti sui breakout che effettivamente “respirano” prima di continuare.
Breakout, retest e rotture fallite
Dopo un breakout dall'Initial Range, l'indicatore monitora cosa fa il prezzo successivamente:
- Conta quante barre rimangono fuori dall'intervallo.
- Verifica se il prezzo si muove abbastanza lontano (distanza minima in %).
- Poi osserva un retest di ritorno nell'intervallo.
Puoi vedere:
- IR60 LONG / IR60 SHORT (breakout)
- Retest LONG / Retest SHORT etichette quando il prezzo torna dopo una mossa solida
- Failed LONG / Failed SHORT etichette quando un breakout fallisce rapidamente e il prezzo rientra nell'intervallo senza impegno.
Questo ti dà tre tipi di informazioni:
- breakout pulito
- breakout sano con retest
- breakout falso/fallito
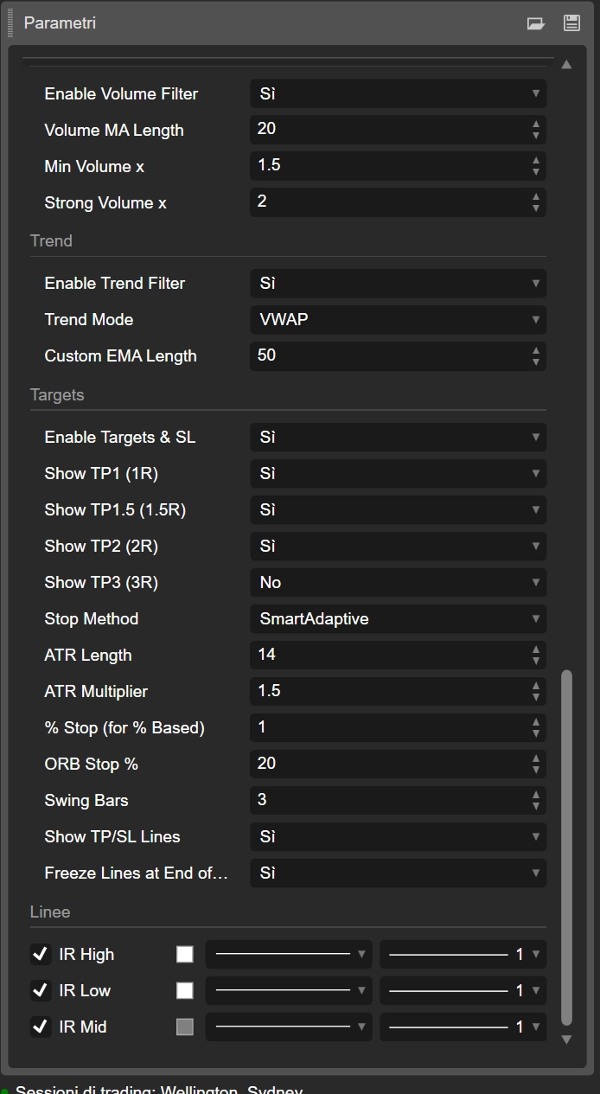
Obiettivi, stop loss e visualizzazione del trade
L'indicatore calcola anche livelli automatici di TP e SL basati su:
- ATR
- % della larghezza dell'IR
- stop % fissi
- punti di swing
- modalità ATR “intelligenti”, adattive e scalate
Dal prezzo di ingresso e dal livello di stop calcola diversi obiettivi:
- TP1 (1R)
- TP1.5 (1.5R)
- TP2 (2R)
- TP3 (3R)
Puoi scegliere quali obiettivi mostrare.
Le linee sono disegnate sul grafico:
- IR_ENTRY_LONG / IR_ENTRY_SHORT
- IR_SL_LONG / IR_SL_SHORT
- IR_TP1 / IR_TP1.5 / IR_TP2 / IR_TP3
Quando il prezzo raggiunge un obiettivo o uno stop, lo stato viene aggiornato e le linee possono essere “congelate” o dopo l'ultimo TP o a fine giornata, a seconda delle tue impostazioni.
In breve
- Vecchio nome: ORB (Opening Range Breakout)
- Nuovo nome: IR (Initial Range) – stesso concetto, denominazione più pulita
- Costruisce intervalli delle prime fasi della sessione (IR5, IR15, IR30, IR60)
- Segna breakout LONG / SHORT, retest, e rotture fallite
- Utilizza filtri di trend, volume, FVG e pullback per migliorare la qualità
- Disegna ingresso, stop e più obiettivi direttamente sul grafico
Quindi quando vedi “IR60 LONG” sul grafico, stai praticamente guardando un Opening Range Breakout sui primi 60 minuti della sessione – solo con un nome più moderno, personalizzabile e con molta più logica dietro.
Riepilogo
The indicator marks breakout signals when price moves above the range high (LONG) or below the range low (SHORT), displaying corresponding labels on the chart. It also tracks retests and failed breakouts, distinguishing clean breakouts, healthy retests, and fake moves.
To improve signal quality, the indicator incorporates multiple filters: trend filters using VWAP and EMA, volume filters comparing current volume to averages, Fair Value Gap (FVG) filters detecting bullish or bearish imbalances near breakout levels, and pullback filters requiring minimum retracements after breakouts.
Additionally, it calculates and plots automatic entry, stop loss, and multiple take profit levels based on ATR, percentage of the initial range width, fixed percentages, swing points, and adaptive ATR modes. These visual aids help traders manage risk and targets directly on the chart.
The Initial Range indicator supports various markets including Forex, stocks, indices, commodities, and cryptocurrencies, and is designed to enhance breakout trading strategies with customizable parameters and comprehensive trade visualization.
Recensioni dei clienti
5 | 100 % | |
4 | 0 % | |
3 | 0 % | |
2 | 0 % | |
1 | 0 % |


