Descrizione
Volume Bubbles – Indicatore Personalizzato per cTrader
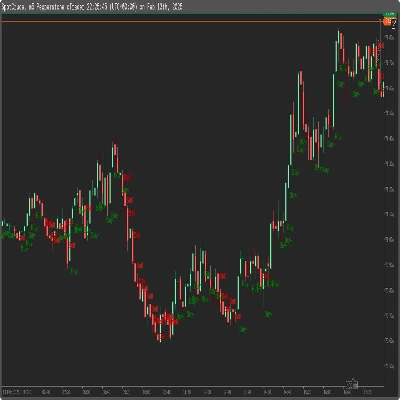
Volume Bubbles è un indicatore visivo leggero ma potente per cTrader che evidenzia le candele con volume eccezionale direttamente sul grafico dei prezzi.
Invece di fissare l'istogramma del volume e cercare di indovinare quali barre contano davvero, questo strumento rileva automaticamente quando il volume della candela corrente è significativamente superiore alla media recente e disegna una bolla (icona circolare) su quella barra:
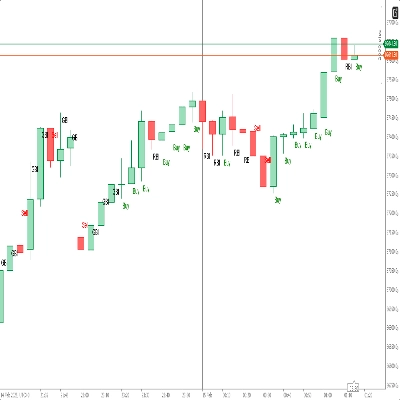
- Per candele rialziste, una bolla viene disegnata sotto il minimo della candela.
- Per candele ribassiste, una bolla viene disegnata sopra il massimo della candela.
Questo rende estremamente facile individuare potenziali movimenti climatici, aree di forte interesse da parte di grandi operatori, o possibili punti di esaurimento del trend.
Caratteristiche principali
- ✅ Rileva candele ad alto volume utilizzando una Media Mobile del volume tick
- ✅ Disegna bolle chiare sul grafico (non è necessaria una finestra secondaria)
- ✅ Colori differenti per picchi di volume rialzisti e ribassisti
- ✅ Offset regolabile in pips per posizionare le bolle lontano dalla candela
- ✅ Opzione per mostrare le bolle solo sull'ultima barra (per il trading in tempo reale)
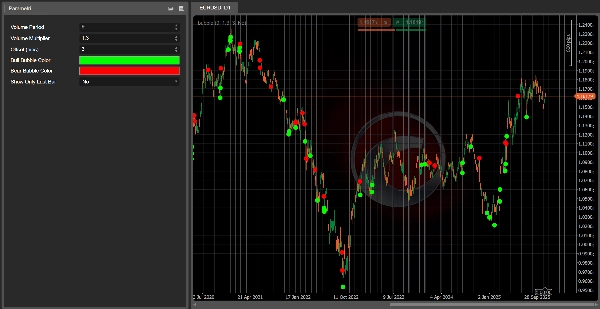
Input / Parametri
- Periodo Volume – Numero di barre usate per la media mobile del volume.
- Moltiplicatore Volume – Quante volte sopra il volume medio deve essere una barra per attivare una bolla.
- Offset (pips) – Distanza tra la bolla e il massimo/minimo della candela.
- Colore Bolla Rialzista – Colore delle bolle sulle candele rialziste.
- Colore Bolla Ribassista – Colore delle bolle sulle candele ribassiste.
- Mostra Solo Ultima Barra – Se vero, mostra le bolle solo sulla barra live corrente.
Come Usare
Aggiungi Volume Bubbles al tuo grafico e usalo come filtro visivo per:
- Confermare rotture supportate da volume forte
- Individuare possibili inversioni o candele di esaurimento
- Identificare zone dove grandi operatori potrebbero essere attivi
Non è un sistema di trading autonomo, ma è un eccellente strumento complementare per qualsiasi strategia di price action o trend-following che tenga conto del volume.
👉 Unisciti qui: Algotrendit Volume Bubbles
All'interno del server troverai:
- Supporto per questo e altri cBot/indicatori
- Discussioni sulla strategia e idee di ottimizzazione
- Aggiornamenti, notizie e futuri strumenti che rilascerò
Riepilogo
Key features include adjustable parameters such as the volume period for averaging, volume multiplier threshold, bubble offset in pips, and customizable colors for bullish and bearish volume spikes. Users can also choose to display bubbles only on the latest bar for real-time trading. The indicator integrates directly on the price chart without requiring additional subwindows.
Volume Bubbles serves as a visual filter to confirm breakouts supported by strong volume, spot possible reversals or exhaustion candles, and identify zones of significant market activity. It complements price action and trend-following strategies by providing volume-based insights across various markets including forex, indices, commodities, stocks, and cryptocurrencies.
Recensioni dei clienti
5 | 0 % | |
4 | 100 % | |
3 | 0 % | |
2 | 0 % | |
1 | 0 % |