
Market Sessions_noSourceCode
Indicateur
271 téléchargements
Version 1.0, Feb 2025
Windows, Mac
Description
Résumé
Résumé IA
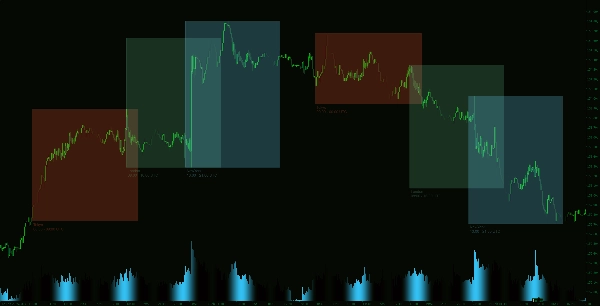
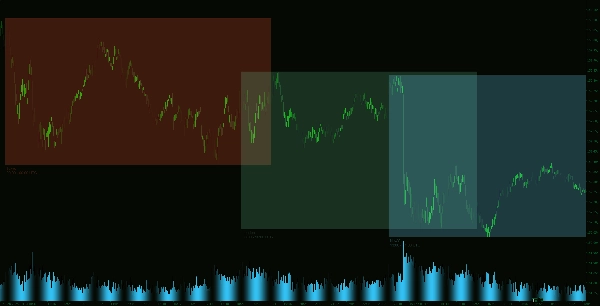
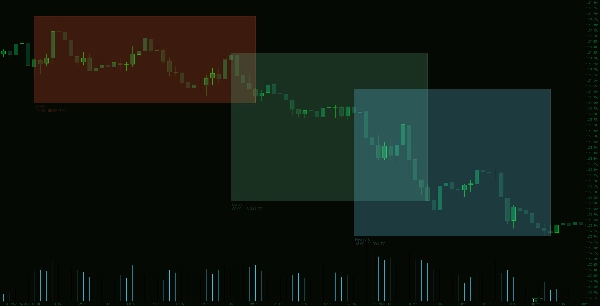
The Market Sessions Indicator is a trading tool designed to visually display the major market sessions—Tokyo, London, and New York—directly on trading charts. It highlights these sessions using customizable colors, allowing traders to tailor the appearance to their chart themes. The indicator draws rectangles representing each session’s high and low price ranges, providing a clear visual reference of market activity during these periods. Users can select how many previous days (up to 10) of session data to display, enhancing historical context. Additionally, the session highlights can be configured as filled or outlined rectangles, aiding in quick identification of active market zones. This indicator supports enhanced market session tracking to assist traders in analyzing price movements relative to global trading hours.
Profil de l'indicateur
Avis clients
0.0
Avis : 0
Avis clients
Il n'y a pas encore d'avis sur ce produit. Vous l'avez déjà essayé ? Soyez le premier à en parler aux autres !
Discussion
Questions fréquentes
Les produits disponibles sur cTrader Store, notamment les bots de trading, les indicateurs et les plug-ins, sont fournis par des développeurs tiers et mis à disposition à titre informatif et à des fins d'accès technique uniquement. cTrader Store n'est pas un courtier et ne fournit aucun conseil en investissement, aucune recommandation personnelle ni aucune garantie quant aux performances futures.


Prix
Depuis le 14/01/2025
55
Ventes
11.52K
Installations gratuites