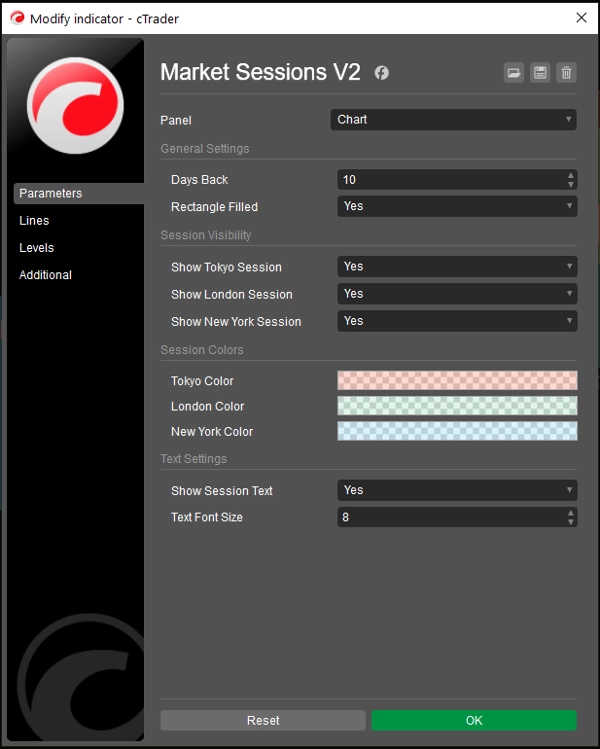
"Market Sessions V2_NSC" logo
Market Sessions V2_NSC
5.0
Reviews: 1
"Market Sessions V2_NSC" uploaded image
Since 14/01/2025
46
Sales
9.66K
Free installs

Market Session v2!

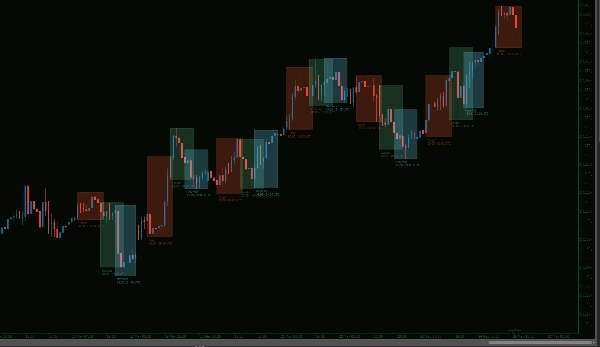
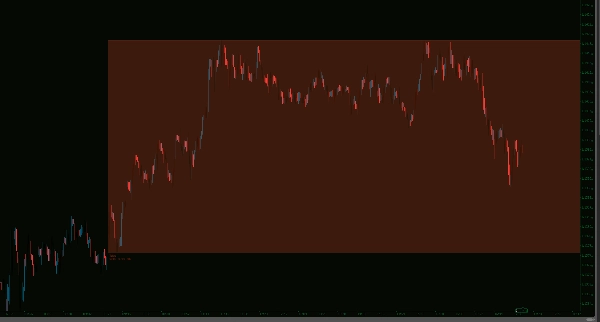
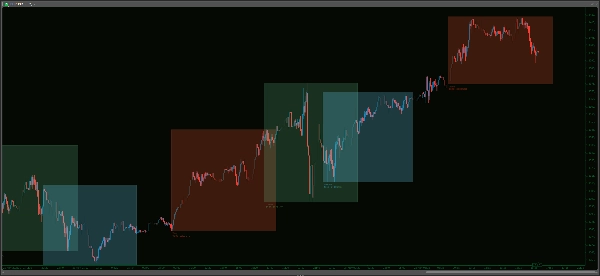
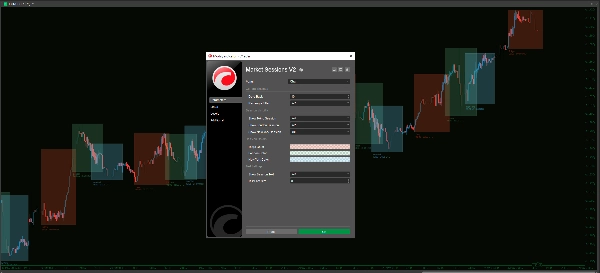
Unlock crucial market insights with the Market Sessions V2 Indicator! Clearly visualize the Tokyo, London, and New York trading sessions directly on your charts, complete with dynamic high/low rectangles. Tailor the display to your exact preferences with customizable colors, filled rectangles, and control over the number of historical days shown. Fine-tune your analysis by toggling individual sessions on or off, and adjust session text visibility and font size for a perfectly clear view. This indicator is an essential tool for any forex trader looking to identify key trading windows, session overlaps, and potential volatility hotspots to enhance their strategy.

------------------------

Feel free to check out my other indicators:

https://ctrader.com/products/1181

https://ctrader.com/products/1182

https://ctrader.com/products/1180

https://ctrader.com/products/1015

https://ctrader.com/products/555
https://ctrader.com/products/553

https://ctrader.com/products/554

https://ctrader.com/products/552

https://ctrader.com/products/557

https://ctrader.com/products/845

https://ctrader.com/products/848

https://ctrader.com/products/847

https://ctrader.com/products/846

https://ctrader.com/products/551

https://ctrader.com/products/574

https://ctrader.com/products/573

https://ctrader.com/products/556

https://ctrader.com/products/558

https://ctrader.com/products/559

https://ctrader.com/products/560


Indicator profile
5.0
Reviews: 1
5
100 %
4
0 %
3
0 %
2
0 %
1
0 %
Customer reviews
August 18, 2025
Pros: Displays Tokyo, London, New York sessions with DST handling and advanced ICT Killzone/SilverBullet time windows. Highly customizable visuals. Cons: No tooltips or alerts. Lacks preset saving and interactive session history/log.
Forex
Products available through cTrader Store, including trading bots, indicators and plugins, are provided by third-party developers and made available for informational and technical access purposes only. cTrader Store is not a broker and does not provide investment advice, personal recommendations or any guarantee of future performance.

More from this author

Track major trading sessions (Tokyo, London, New York) with customizable colors and visual sessions on your chart.
Auto-detect supply & demand zones, remove broken levels, and trade smarter with real-time alerts. Precision made simple.
Supply and demand zones. They're important. Here's a free version to get you started!
Version 3: Full control of session display including start and end times of all 3 sessions!
VWAP Set to London Open
The Multi-Timeframe Candle Indicator displays candles from multiple timeframes in one window, enhancing market analysis!
VWAP Set to Tokyo Open
RCS: 8 majors! AUD,USD,EUR,JPY,GBP,CAD,CHF,NZD. Find how strong each currency is relatively and trade smarter!
US Dollar Index
Stay ahead with a real-time countdown to candle closes on all key timeframes: 5m, 15m, 30m, 1H, 4H, and Daily.
Smart Money Suite (Lite): BOS, CHoCH, Swing structure, PDH/PDL & session killzones. Essential SMC tools, zero clutter.
The Advanced Volume Profile Indicator calculates POC, Median, and Mode, revealing key price levels for smarter trading.

You may also like

 this moving include everything that a trader needs from Moving Average.
TECHNICAL ANALYSIS, WITH SOUND ALERT
Stay ahead with a real-time countdown to candle closes on all key timeframes: 5m, 15m, 30m, 1H, 4H, and Daily.
🚀 TrendHeikinMultiMA: Advanced trend detection using Heikin-Ashi smoothing & MAs! Eliminates noise, confirms real trend
Wstęgi HTS 33 144 mobile
Right-anchored cTrader Volume Profile with VAH/VAL/POC, LVZ, top volume+EMA, themes, and fast, readable visuals.
SCOB - Single Candle Order Block Indicator
A simple indicator that tracks the value of your open trades in pips.
Visualize trading sessions with high/low levels, customizable colors, and live open session display
"Identify key market zones and visualize support/resistance from multiple timeframes on a single chart.
Rolling Z-Score Trend Heat — See the Market's Temperature in Real Time
show spread on chart
The Advanced CCI & EMA Indicator combines the CCI with 40 & 80 EMA logic to generate precise arrows signaling direction
Clarost traz a melhor probabilidade de risco retorno
A precision overlay tool that combines session-aware VWAP logic and standard deviations.
Identify key support and resistance levels through detailed volume distribution analysis.
Provides comprehensive trend and momentum analysis by combining EMAs, RoC, normalized ATR, RSI, and volume..
Measure Market Strength at a Glance – Instantly
Since 14/01/2025
46
Sales
9.66K
Free installs