"DXY w HMA" logo
DXY w HMA
"DXY w HMA" uploaded image
Since 14/01/2025
46
Sales
9.67K
Free installs

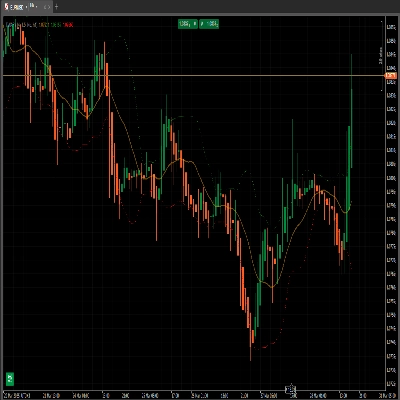
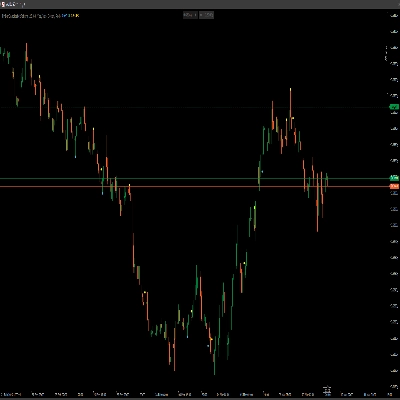
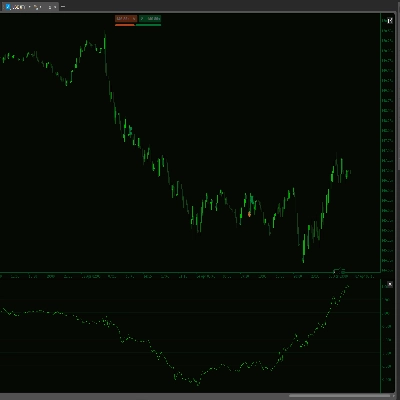
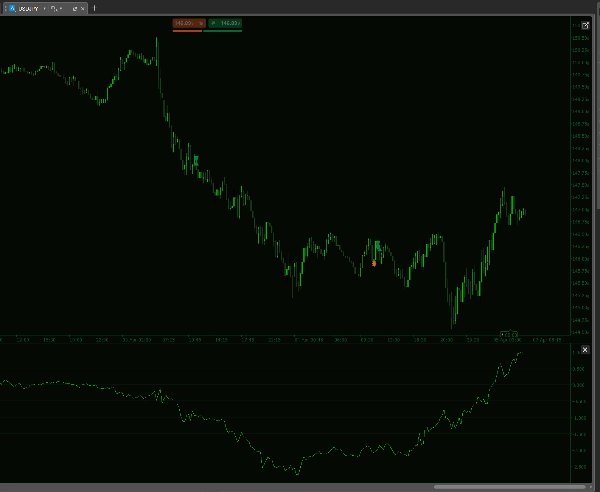
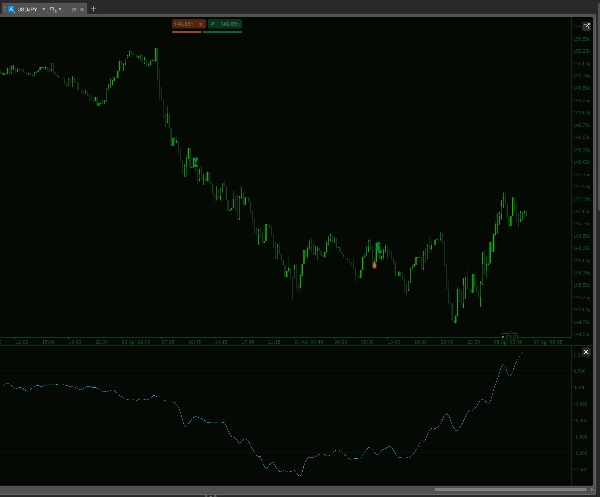
Elevate your trading strategy with the Historical DXY HMA Indicator—a cutting-edge cTrader tool engineered for precision and performance. This advanced indicator calculates a custom U.S. Dollar Index by combining the weighted percentage changes of six key currency pairs, providing you with a dynamic and reliable market gauge.

Key Features:

  • Custom DXY Calculation: Integrates six major USD pairs (EURUSD, USDJPY, GBPUSD, USDCAD, USDCHF, USDSEK) with configurable weights for a finely tuned index.
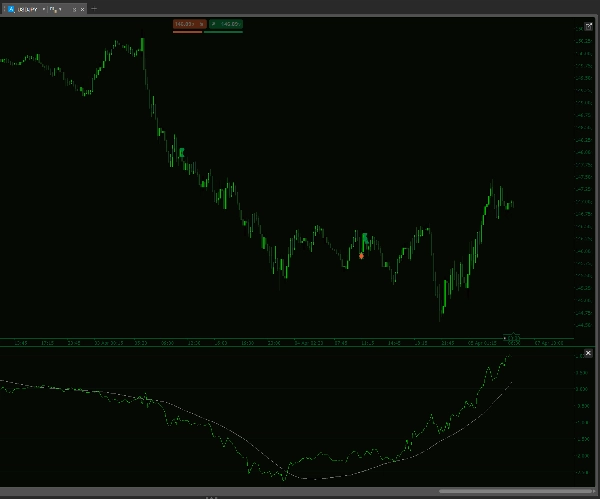
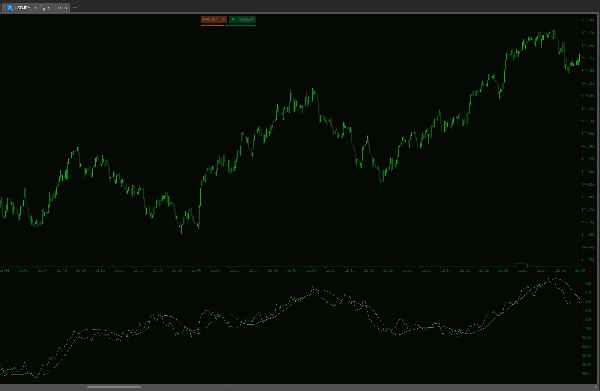
  • Dual Hull Moving Averages: Employs both short- and long-period Hull MAs to offer a clear picture of market trends and momentum.
  • Slope Smoothing: Enhances trend detection with a smoothed slope HMA, giving you an edge in identifying market reversals.
  • Robust Data Handling: Seamlessly syncs with your cTrader platform, ensuring accurate real-time analysis even when dealing with varying data sources.
  • Customizable Parameters: Fine-tune lookback counts and moving average periods to perfectly match your trading style and market conditions.

Designed with the modern trader in mind, the Historical DXY HMA Indicator simplifies complex market data into actionable insights, enabling you to make smarter, more confident trading decisions. Experience the next level of market analysis!


--------------------------

Please feel free to check out my other indicators!

https://ctrader.com/products/1181

https://ctrader.com/products/1182

https://ctrader.com/products/1180

https://ctrader.com/products/1015

https://ctrader.com/products/555

https://ctrader.com/products/553

https://ctrader.com/products/554

https://ctrader.com/products/552

https://ctrader.com/products/557

https://ctrader.com/products/845

https://ctrader.com/products/848

https://ctrader.com/products/847

https://ctrader.com/products/846

https://ctrader.com/products/551

https://ctrader.com/products/574

https://ctrader.com/products/573

https://ctrader.com/products/556

https://ctrader.com/products/558

https://ctrader.com/products/559

https://ctrader.com/products/560


Indicator profile
0.0
Reviews: 0
Customer reviews
No reviews for this product yet. Already tried it? Be the first to tell others!
Forex
Indices
EURUSD
USDJPY
Products available through cTrader Store, including trading bots, indicators and plugins, are provided by third-party developers and made available for informational and technical access purposes only. cTrader Store is not a broker and does not provide investment advice, personal recommendations or any guarantee of future performance.

More from this author

Track major trading sessions (Tokyo, London, New York) with customizable colors and visual sessions on your chart.
Auto-detect supply & demand zones, remove broken levels, and trade smarter with real-time alerts. Precision made simple.
Market Session V2: Full Control. colors, history, session/text toggles, font size. Elevate your strategy!
Version 3: Full control of session display including start and end times of all 3 sessions!
Supply and demand zones. They're important. Here's a free version to get you started!
The Multi-Timeframe Candle Indicator displays candles from multiple timeframes in one window, enhancing market analysis!
VWAP Set to London Open
The Advanced Volume Profile Indicator calculates POC, Median, and Mode, revealing key price levels for smarter trading.
VWAP Set to Tokyo Open
RCS: 8 majors! AUD,USD,EUR,JPY,GBP,CAD,CHF,NZD. Find how strong each currency is relatively and trade smarter!
US Dollar Index
Stay ahead with a real-time countdown to candle closes on all key timeframes: 5m, 15m, 30m, 1H, 4H, and Daily.

You may also like

🔮Channel Price Predictor: Anticipates future price zones with trend channels based on volatility and projections." 📈
Customize the MACD! Choose colors, get real-time tick updates, and see crossover points for enhanced trading precision.
Market entropy + DC. Spot crystallization/chaos shifts with an optional on-chart overlay.
First Presented Fair Value Gap (FPFVG)
Trend-coloring Donchian cloud that highlights volatility squeezes and breakouts.
A custom support resistance indicator, specifically designed for scalping techniques.
KAMA Keltner – Adaptive Volatility Channel for Precision Trading
Daily/Weekly/Monthly - Highs & Lows Indicator (Customizable Settings)
setup tabajara
L'indicatore UTBot è uno strumento di analisi tecnica che crea una linea di trailing stop dinamica basata sull'ATRT
uses HTF 1hr,4hr, 1D to check for valid directions enjoy
Automated Fibonacci Retracement, Expansion, Fan & Time Zones from unified swing detection. Multi-timeframe capable.
Lightweight utility indicator designed to preload and persist custom colors in cTrader’s “Recent Colors” list.
Elliott Wave Structure Pro v2.0 (Non-Repainting) Structure, Elliott, Continuation Entries
Multi Timeframe Candle Countdown
Trend Mosaic. Chart Art and Trading Signal Impressions.
The Candlestick Patterns Dashboard. Detects 30+ patterns with Strength %, Trend Filters, Alerts & Win Rate Stats. 📉📈
🎯 Order Block Detector - Smart Trading: Identifica bloques de órdenes clave en cTrader para un trading más inteligente.
Since 14/01/2025
46
Sales
9.67K
Free installs