Description
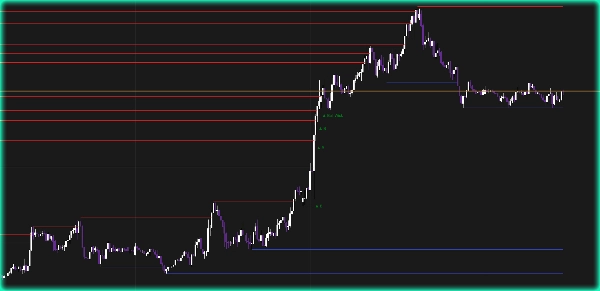
Support & Resistance Levels with Breaks by [BeyondTrading] — See every live level and every real break. Automatically detects pivot highs and lows and draws horizontal support and resistance lines directly on the chart. Each line extends bar by bar in real time as long as the level holds. The moment price closes through it, the line stops — exactly at the point of contact. No manual drawing, no stale levels cluttering your chart.
When a level is broken, a signal appears immediately: B for a clean break with volume, Bull Wick or Bear Wick when the close is driven by a wick rather than a real body close. The volume filter eliminates low-conviction moves and keeps only the signals that matter.
Why S/R levels matter Support and resistance levels are not just lines — they are liquidity pools. Every time price has rejected a level, stop orders and pending orders accumulate just above and below it. When price returns, institutions come to either defend the level or hunt the stops sitting there before the real move begins. A resistance level that has been tested three times and never broken is not random — it is where sell orders are stacked and where breakout traders will be trapped if the move is fake. Knowing which levels are still active and which have already been taken tells you exactly where the next reaction is likely to happen.
Features
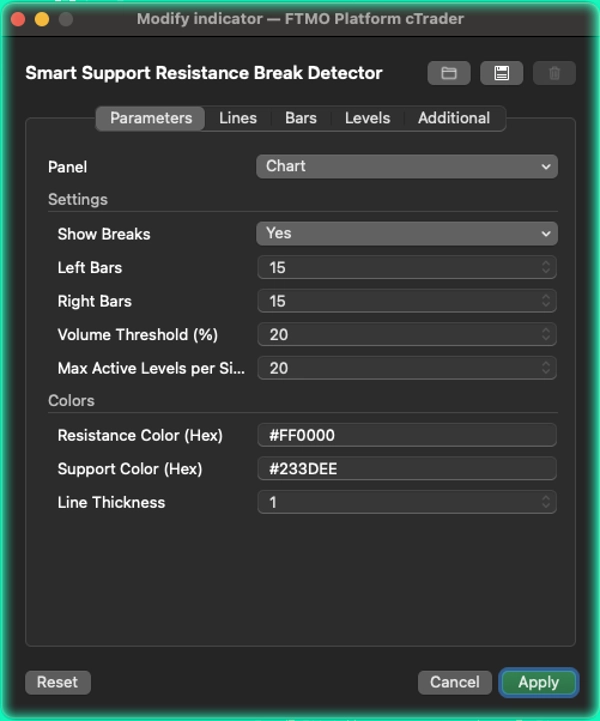
- Pivot detection with configurable Left Bars and Right Bars for any style of trading
- Lines extend dynamically on every bar — they stop the instant price closes through them
- Volume filter (EMA 5/10 oscillator) to distinguish real breaks from noise
- Break labels: B for clean volume breaks, Bull Wick and Bear Wick for wick-driven moves
- Duplicate filtering — levels too close to existing ones are automatically ignored
- Max Active Levels per side to keep the chart clean and readable
- Fully configurable resistance and support colors with hex input
Summary
The indicator features volume-confirmed break signals to distinguish genuine breakouts from low-conviction moves. It displays specific labels: "B" for clean volume breaks, and "Bull Wick" or "Bear Wick" when breaks are driven by wicks rather than body closes. A volume filter based on EMA oscillators helps filter out noise.
Additional functionalities include configurable pivot detection parameters (Left Bars and Right Bars), automatic filtering of duplicate levels, and limits on the maximum number of active levels per side to maintain chart clarity. Users can customize support and resistance line colors using hex codes.
This tool is designed to highlight key liquidity pools where institutional orders accumulate, aiding traders in identifying active levels and potential reaction points in the market.