
H Capital Liquidity Map Lite V1
Indicator
249 downloads
Version 1.0, Mar 2026
Windows, Mac
Description
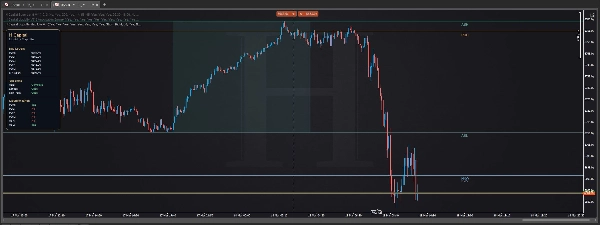
H Capital Liquidity Map Lite is a free charting tool designed for traders who want structure without clutter.
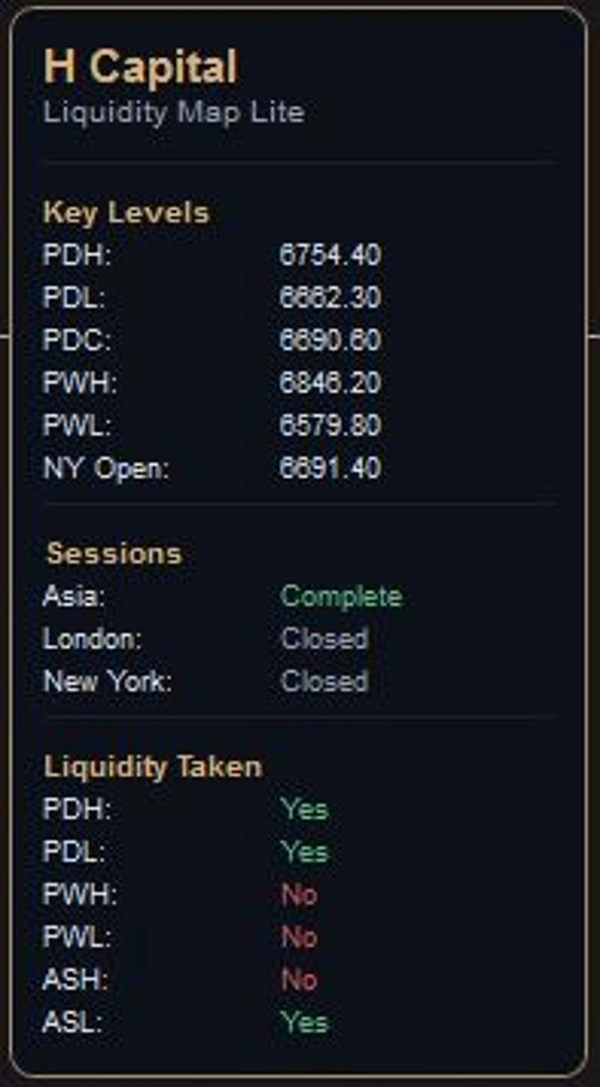
It maps the key market references many traders monitor every day:
- previous day high
- previous day low
- previous day close
- previous week high
- previous week low
- New York open
- Asia session range
- liquidity taken status
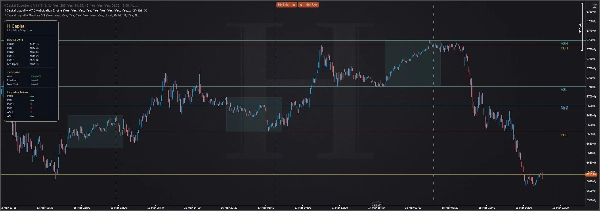
The goal is simple: give traders a clean framework before execution.
Rather than flooding the chart with signals, H Capital Liquidity Map Lite focuses on the levels and session references that help build context. The interface is designed with a premium minimalist style so the chart stays readable while the information remains accessible at a glance.
Best for:
- index traders
- forex traders
- metals traders
- liquidity-based traders
- traders who prefer clean charts
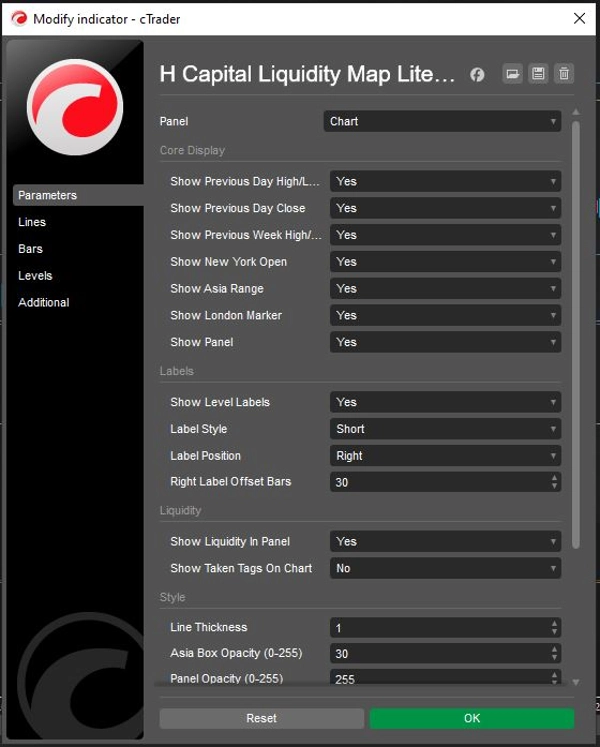
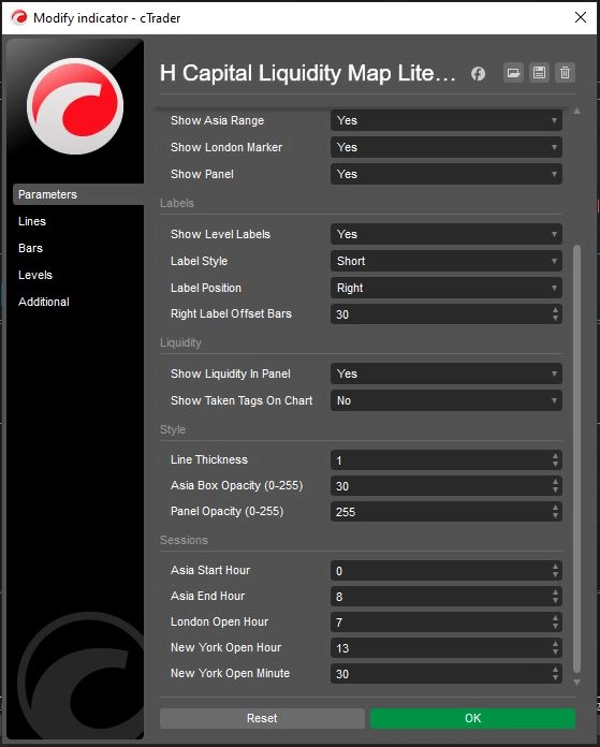
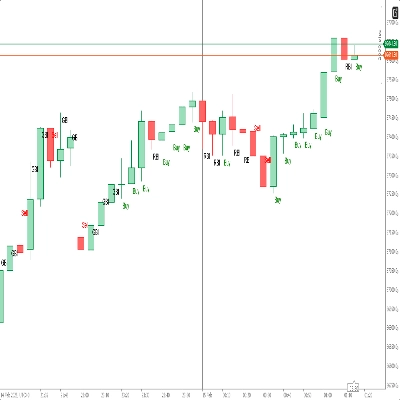
What it does:
- maps key daily and weekly liquidity levels
- displays session structure
- tracks whether important levels have been taken
- keeps information organized through a premium on-chart panel
What it does not do:
- does not generate buy/sell signals
- does not replace execution judgment
- does not function as an alert engine
This is not a signal tool. It is a professional market map.
Summary
AI summary
H Capital Liquidity Map Lite is a charting tool designed to provide traders with a clear, uncluttered view of key daily and weekly liquidity levels. It displays important market references such as the previous day’s high, low, and close; previous week’s high and low; New York open; Asia session range; and liquidity taken status. The tool organizes this information within a minimalist, premium on-chart panel to maintain readability and quick accessibility.
This indicator is suited for traders in indices, forex, metals, and those focusing on liquidity-based strategies who prefer clean chart layouts. It helps build market context by mapping session structures and tracking whether significant levels have been breached. The tool does not generate buy or sell signals, replace execution judgment, or function as an alert system. Instead, it serves as a professional market map to support informed trading decisions.
This indicator is suited for traders in indices, forex, metals, and those focusing on liquidity-based strategies who prefer clean chart layouts. It helps build market context by mapping session structures and tracking whether significant levels have been breached. The tool does not generate buy or sell signals, replace execution judgment, or function as an alert system. Instead, it serves as a professional market map to support informed trading decisions.
Indicator profile
Customer reviews
0.0
Reviews: 0
Customer reviews
No reviews for this product yet. Already tried it? Be the first to tell others!
Discussion
FAQ
Prop
Forex
Indices
Commodities
Crypto
Grid
Products available through cTrader Store, including trading bots, indicators and plugins, are provided by third-party developers and made available for informational and technical access purposes only. cTrader Store is not a broker and does not provide investment advice, personal recommendations or any guarantee of future performance.


Price
Since 09/03/2026
1.58M
Traded volume
15.43K
Pips won
249
Free installs