Description
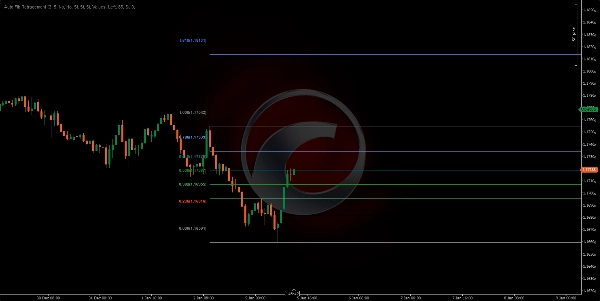
https://chartshots.spotware.com/c/695bff3f3bc21
https://chartshots.spotware.com/c/695bffac03fb1
https://chartshots.spotware.com/c/695c0002aabb7
📊 Auto Fib Retracement
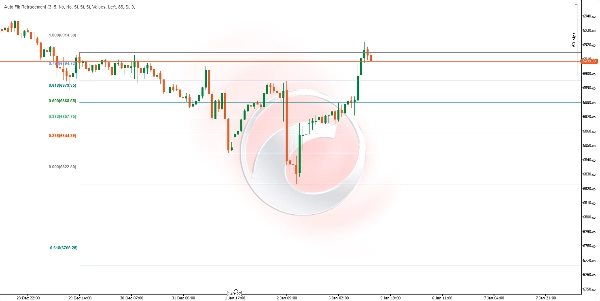
Auto Fib Retracement is a technical analysis indicator that automatically plots Fibonacci retracement and extension levels based on the most recent significant price movements. Unlike manual Fibonacci tools, this indicator detects market pivot points automatically and updates levels in real-time.
⚙️ How Does It Work?
Automatic Pivot Detection
The indicator uses a dynamic ZigZag algorithm to identify significant price highs and lows:
- Lookback (Depth): Defines how many bars are analyzed backward to confirm a pivot point. A higher value detects larger swings; a lower value is more sensitive to smaller movements.
- Sensitivity (Deviation): Controls how significant a price move must be to form a new pivot. It's calculated by multiplying the 10-period ATR (Average True Range) by this factor. Higher values filter out noise and only detect important movements.
Fibonacci Levels Calculation
Once the two latest pivots (a high and a low) are identified, the indicator calculates each level using the classic Fibonacci formula:
Level = Anchor Price + (Movement Range × Fibonacci Ratio)
Where:
- Anchor Price: The price of the most recent pivot (or the previous one if the direction reverses)
- Movement Range: The difference between the two pivots
- Available Ratios: 0, 0.236, 0.382, 0.5, 0.618, 0.65, 0.786, 1, 1.272, 1.414, 1.618, 1.65, 2.618, 2.65, 3.618, 3.65, 4.236, 4.618, and negative levels (-0.236, -0.382, -0.618, -0.65)
📈 What Is It For?
UseDescription
Identify Support & Resistance
Levels 0.382, 0.5, and 0.618 are classic zones where price tends to react 🔵
Define Price Targets
Extension levels (1.618, 2.618, 3.618, 4.236) help project how far a move might go 🎯
Plan Entries
Look for pullbacks to key levels to enter in the direction of the trend ⬆️⬇️
Set Stop-Losses
Place stops beyond relevant Fibonacci levels 🛑
Confirm Reversal Zones
When price reaches extreme extension levels, it may indicate exhaustion 🔄
🛠️ How to Use It
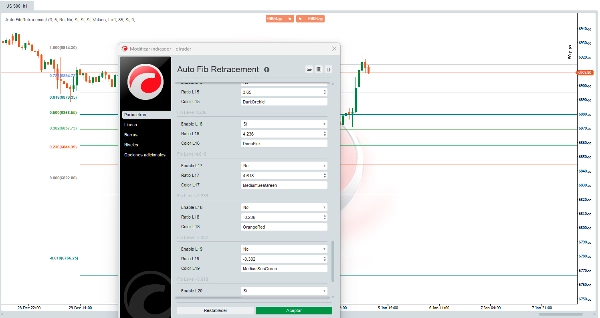
Main Parameters
ParameterDescriptionSuggested Value
Sensitivity
Deviation multiplier to filter minor movements
3 (default)
Lookback
Minimum number of bars to calculate pivots
10 (default)
Invert Direction
Reverses the reference point for level calculation
Disabled
Display Options
OptionFunction
Extend Left / Right
Extends horizontal lines to the left or right of the chart
Display Prices
Shows the exact price of each level
Display Ratios
Shows the Fibonacci ratio (values or percentage)
Tag Position
Positions labels to the left or right
Zone Opacity
Controls the transparency of colored zones between levels
Configurable Fibonacci Levels
Each of the 22 levels can be:
- Individually activated or deactivated
- Have its numerical value modified
- Have its color changed
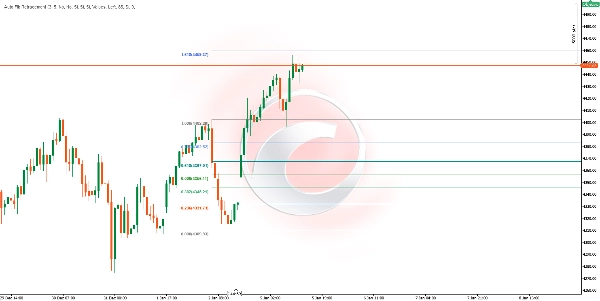
💡 Interpreting the Zones
Colored zones between consecutive levels facilitate visual identification:
- Green/Blue Zones (0.382 - 0.786): Area of healthy pullback in trends. Common zone to look for entries. ✅
- Level 1.0 Zone: Represents 100% of the previous move. Acts as key support/resistance. ⚖️
- Red/Pink Zones (1.618+): Extensions of the movement. Price reaching these zones may indicate over-extension. ⚠️
⚠️Considerations
- The indicator updates automatically when it detects new significant pivots
- It works on any timeframe and financial asset
- Fibonacci levels are probability zones, not guarantees
- Recommended to be used in confluence with other indicators or price action analysis
- In ranging or choppy markets, pivots may change frequently
📝 Technical Notes
- The 10-period ATR is used internally to calculate the dynamic threshold for pivot detection
- The indicator requires a minimum historical data equivalent to double the Lookback parameter to function correctly
- Lines and zones are redrawn only on the last bar to optimize performance 🚀
Summary
The indicator helps traders identify potential support and resistance zones, define price targets, plan entries on pullbacks, set stop-losses beyond key levels, and confirm reversal zones when price reaches extreme extensions. It works on any timeframe and financial asset, including Forex, stocks, commodities, indices, and cryptocurrencies such as BTCUSD, EURUSD, GBPUSD, XAUUSD, NAS100, and others.
Users can customize parameters like sensitivity, lookback period, direction inversion, and display options (line extension, price and ratio labels, zone opacity, and colors). Colored zones visually highlight key Fibonacci areas for easier interpretation. The indicator updates automatically with new pivots and redraws levels on the latest bar to optimize performance.