"EconomicForex" logo
Indicator
96 downloads
Version 1.0, Mar 2025
Windows, Mac
"EconomicForex" uploaded image
103
Sales
6.8K
Free installs

✔ Website to enter data ,enter the indicators tab: https://tradingeconomics.com/


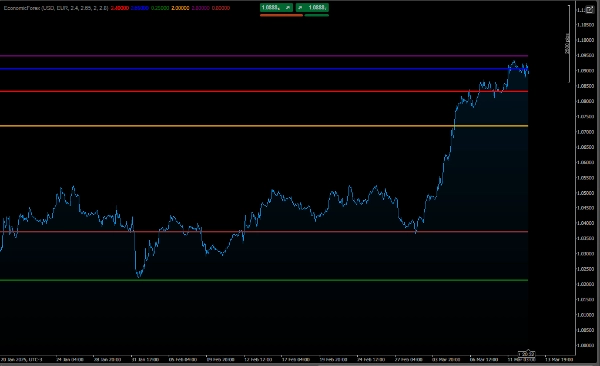
How to Interpret the Graph

Difference between Nominal and Real Interest Rates:

The nominal interest rate is the gross value of the interest rate.

The real interest rate takes inflation into account, showing the real purchasing power of money.

If inflation is higher than the nominal interest rate, the real interest rate will be negative, indicating a loss of purchasing power.

Currency Comparison:

The graph allows you to compare the economic conditions of the two currencies.

For example, if the real interest rate of the main currency is higher than that of the counterpart currency, this may indicate that the main currency is more attractive for investment.

Evolution Over Time:

The lines show how the inflation, nominal interest and real interest rates change over time, allowing you to identify trends.

Usage Example

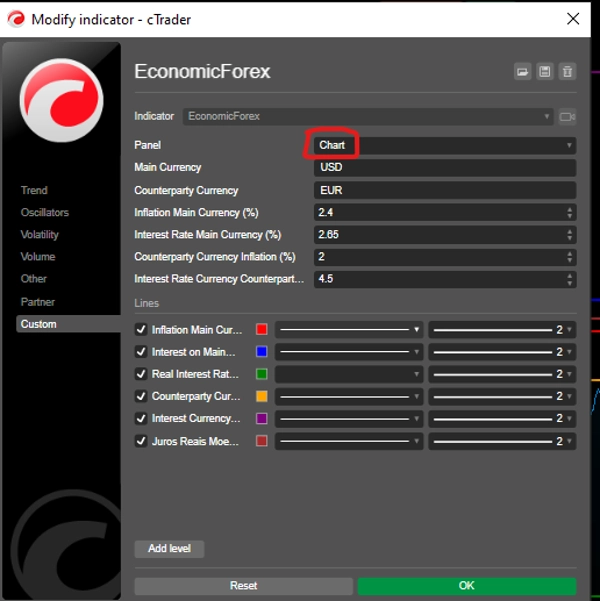
Suppose you set the parameters as follows:

Main Currency: USD (US Dollar)

Inflation: 5%

Nominal Interest Rate: 6.5%

Counterparty Currency: EUR (Euro)

Inflation: 2%

Nominal Interest Rate: 4%

The chart will show:

USD:

Real Interest: 1.5% (6.5% - 5%)

EUR:

Real Interest: 2% (4% - 2%)

With this, you can compare the economic conditions of USD and EUR and make informed decisions in the forex market.

Conclusion

This code is a useful tool for traders and analysts who want to monitor and compare economic indicators of two currencies in a forex pair. It provides insights into inflation, nominal interest rates, and real interest rates, helping to understand the macroeconomic scenario and its implications for the forex market.

see this low risk algorithm:👇🏻

https://ctrader.com/pt/products/601?u=carneiroads

https://ctrader.com/pt/products/623?u=carneiroads

Indicator profile
0.0
Reviews: 0
Customer reviews
No reviews for this product yet. Already tried it? Be the first to tell others!
Forex
EURUSD
Products available through cTrader Store, including trading bots, indicators and plugins, are provided by third-party developers and made available for informational and technical access purposes only. cTrader Store is not a broker and does not provide investment advice, personal recommendations or any guarantee of future performance.

More from this author

cBot
Forex
BTCUSD
+5
Intelligent negotiations and analysis!
47.3%
ROI
3
Profit factor
2%
Max drawdown
cBot
XAUUSD
Scalping
Precision Scalper,XAUUSD ,Averages that functions like a multidimensional radar:
34.8%
ROI
2.12
Profit factor
5%
Max drawdown
Indicator
Order BlockIndicator reversal
cBot
ATR
RSI
+4
Intelligent system, Available any instrument. Profit 12. Drawdown 1%
12.29
Profit factor
1.44%
Max drawdown
Indicator
Forex
Fair Value Gap
Volume Profile Price Period and Live VAH,VAL,POC,
cBot
RSI
MACD
+2
Chart Patterns Algo Bot
Indicator
SMC
Prop
+12
BoS ChoCH Pro,Strict Mode,False Breakout Filter,Average hit rate: 72-78%
Indicator
Forex
BTCUSD
+5
INDICATOR,LIQUIDITY POOLS,ACCURATE SIGNAL, NO DELAY,80% PROBABILITY
Indicator
PVA Volume Analysis Indicator:Price volume over trend strength and direction
cBot
EMA
BTCUSD
+5
Precision Scalper Bots QUANT ,XAUUSD ,
13.8%
ROI
3
Profit factor
5.97%
Max drawdown
Indicator
Signal
Indicator,combines with several strategies.MA locate trends,pullback, signal volumes, reversals, support and resistance
cBot
AI
XAUUSD
POSITION 5000 Pips: The Ultimate Algorithm for Gold
16.8%
ROI
4
Profit factor
5%
Max drawdown

You may also like

Indicator
CandleCounterAlex – Candle Cycle Counter with Colors and Adjustable Position.
Indicator
BOS
Fibonacci
+4
Automatically draws major trading sessions, killzones, and SMC daily liquidity targets directly on your cTrader charts.
Indicator
MSS
Market Structure
NY HTF Candles is a precision panel designed specifically for institutional traders
Indicator
Volume Profile plots traded volume at each price level, highlighting high activity zones of precise support & resistance
Indicator
Forex
NZDUSD
+2
RCS: 8 majors! AUD,USD,EUR,JPY,GBP,CAD,CHF,NZD. Find how strong each currency is relatively and trade smarter!
Indicator
Track major trading sessions (Tokyo, London, New York) with customizable colors and visual session highlights on your ch
Indicator
Forex
BTCUSD
+5
Buy-Side & Sell-Side Liquidity (BSL/SSL) Indicator
Indicator
Grid
Prop
+16
With this Fibonacci retracement indicator, traders have full control over the retracement levels displayed on the chart.
Indicator
BOS
MSS
+5
WinSMC is an overlay SMC indicator for cTrader. It helps you visually identify!
Indicator
Forex
Multi-timeframe candlesticks!
Indicator
Forex
BTCUSD
+5
Cross EMA Pro – Trend Reversal Indicator
Indicator
VWAP
NAS100
+5
Key NY session opens for NASDAQ (US100) & SP500 to find Tick Precise Entrys for High R:R intraday setups.
Indicator
RSI
SMC
+17
Turn WaveTrend Cross into a BTC profit machine precise buy sell signals, smart momentum edge, no lag trading system
Indicator
Market Structure
Support & Resistance
Auto-centers price when it moves beyond threshold. Adjustable zoom. Works on any chart type. Never lose price again.
Indicator
Fibonacci
Clear pivot levels. Clean S/R zones. Five methods. Any timeframe.
Indicator
Clean trend indicator using CCI & ATR. Highlights up/down trends with adaptive, no-repaint lines.
Indicator
ADX
ATR
+5
Lass System: Non-repainting M5 cTrader indicator with winrate dashboard & multi-asset alerts (Gold, BTC, EURUSD).
Indicator
Forex
BTCUSD
+10
Enhance trading with TSI! Use the True Strength Index for clear insights into market momentum and trend strength.
103
Sales
6.8K
Free installs