Description
Main Objective:
Map volume distribution by price level to identify:
High liquidity areas
Low liquidity areas
Imbalances between buyers and sellers
This indicator is powerful to understand the market structure and identify high probability areas for operations! 🎯
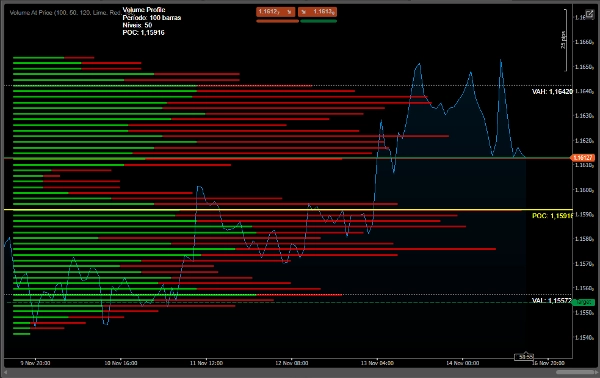
1. POC (Point of Control)
Linha Amarela - Price with highest traded volume
Area of greatest liquidity and price
Natural support/resistance
2. Value Area
White line lines - Area where 70% of the volume was traded
VAH (Value Area High) - Upper limit
VAL (Value Area Low) - Lower limit
Market balance zone
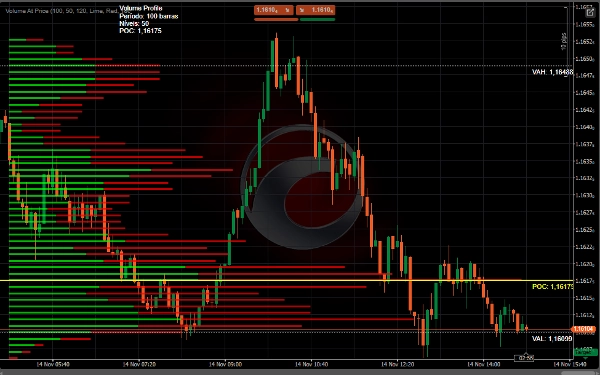
3. Cores of Volume
🟢 Green - Dominant Buying Volume
🔴 Vermelho - Dominant selling volume
Bar Length = Volume Intensity
📊 Use Strategies
1. Identification of Supports and Resistances
• POC functions as support/resistance dynamic
• Value Area defines balance zone
• Important S/R profile edges
2. Breakout Analysis
• Break above VAH → High trend
• Break below the VAL → Downtrend
• Non-break volume confirms movement
3. Entry Points
• Purchase: Retest the VAL with buyer volume
• Sell: Retest VAH with seller volume
• Fade: Operate against extremes of the profile
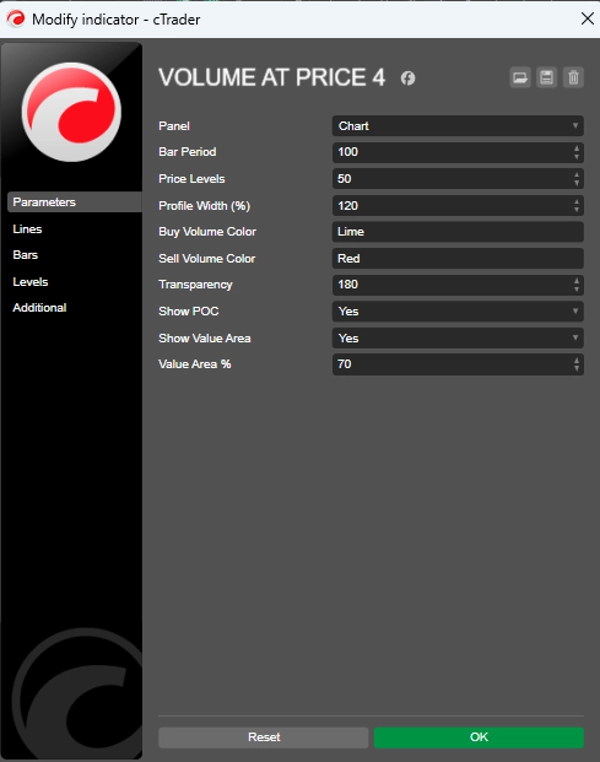
⚙️ Recommended Configurations
For Day Trading
csharp
Period = 50-100
Price Levels = 50
Profile Width = 120%
Value Area % = 70
For Swing Trading
csharp
Period = 100-200
Price Levels = 80
Profile Width = 150%
Value Area % = 70
✅ PROS:
Identifies dynamic supports/resistances
Show market intent (volume)
Reveals important liquidity areas
Clear visualization of imbalances
Contagem current volume ticks
Summary
- Point of Control (POC): The price level with the highest traded volume, acting as a dynamic support or resistance.
- Value Area: The price range where 70% of volume is traded, defined by Value Area High (VAH) and Value Area Low (VAL), representing market balance zones.
- Volume Cores: Colored bars indicating dominant buying (green) or selling (red) volume, with bar length reflecting volume intensity.
The indicator supports strategies like identifying support and resistance levels, breakout analysis (trend direction based on VAH and VAL breaks), and entry points (buy near VAL with buyer volume, sell near VAH with seller volume, or fade at profile extremes).
Recommended settings vary by trading style: for day trading, shorter periods and narrower profiles; for swing trading, longer periods and wider profiles. This tool aids in visualizing liquidity, market intent, and volume imbalances to inform trading decisions.
Customer reviews
5 | 0 % | |
4 | 50 % | |
3 | 50 % | |
2 | 0 % | |
1 | 0 % |


!["[Stellar Strategies] MARSI Signal Plotter" logo](https://cdn.ctrader.com/image/webp/7b2b8da6-8f8e-4646-8d4a-4710c516c01e_25567)