
Sero
Indicator
104 downloads
Version 1.0, Mar 2026
Windows, Mac
Description
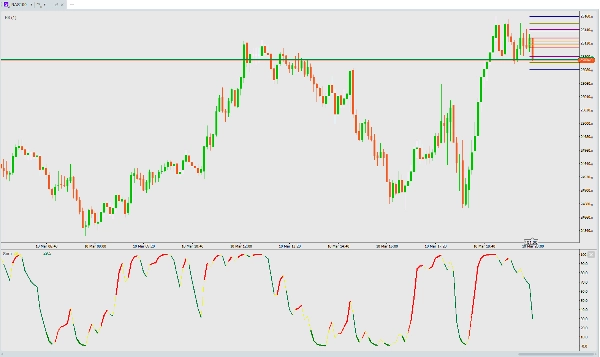
Sero — Momentum Oscillator
Sero is a stochastic-based momentum oscillator that gives clear, color-coded visual signals for market momentum shifts.
How It Works
Sero calculates a smoothed stochastic value from the Typical Price (High+Low+Close)/3 over a 15-bar range, then applies a fast 2-period EMA to produce a responsive 0–100 oscillator.
What to Look For
Colors tell the story:
- Yellow line — the base Sero value (always visible)
- Red line — bullish momentum (Sero is rising)
- Thick Red line — strong bullish momentum (rising + above 20 — confirming breakout from oversold)
- Green line — bearish momentum (Sero is falling)
- Thick Green line — strong bearish dump (falling + below 20 — deep in oversold territory)
Key signals:
- Buy signal — Color flips from Green to Red, especially from below 20 (oversold reversal)
- Sell signal — Color flips from Red to Green, especially from above 80 (overbought reversal)
- Strong trend — Thick lines confirm momentum conviction
- Exhaustion — Thick Green below 20 = sellers may be running out of steam, watch for reversal
Best Practices
- Works on any timeframe and any instrument
- Combine with price action or support/resistance levels for confirmation
- Color transitions near extremes (0 or 100) are the highest-probability signals
- No settings needed — optimized and ready to use out of the box
Summary
AI summary
Sero is a stochastic-based momentum oscillator designed to identify market momentum shifts through clear, color-coded visual signals. It calculates a smoothed stochastic value from the Typical Price [(High + Low + Close) / 3] over a 15-bar range, then applies a fast 2-period exponential moving average (EMA) to generate a responsive oscillator ranging from 0 to 100.
The indicator displays multiple colored lines to represent momentum states:
- Yellow line: base Sero value (always visible)
- Red line: bullish momentum (rising oscillator)
- Thick red line: strong bullish momentum (rising and above 20, indicating breakout from oversold)
- Green line: bearish momentum (falling oscillator)
- Thick green line: strong bearish momentum (falling and below 20, indicating deep oversold conditions)
Key signals include buy signals when the color flips from green to red, especially below 20 (oversold reversal), and sell signals when it flips from red to green, especially above 80 (overbought reversal). Thick lines confirm strong momentum trends, while thick green lines below 20 may indicate exhaustion of selling pressure and potential reversal.
Sero works on any timeframe and instrument without requiring user settings, and it is recommended to combine it with price action or support/resistance levels for confirmation. Color transitions near extremes (0 or 100) provide the highest-probability signals.
Indicator profile
Customer reviews
0.0
Reviews: 0
Customer reviews
No reviews for this product yet. Already tried it? Be the first to tell others!
Discussion
FAQ
BTCUSD
Forex
Signal
Indices
EURUSD
Commodities
GBPUSD
NZDUSD
Crypto
Stocks
XAUUSD
NAS100
USDJPY
Products available through cTrader Store, including trading bots, indicators and plugins, are provided by third-party developers and made available for informational and technical access purposes only. cTrader Store is not a broker and does not provide investment advice, personal recommendations or any guarantee of future performance.
More from this author


Price
Since 10/03/2026
104
Free installs