„FZ“-Logo
FZ
In „FZ“ hochgeladenes Bild
Seit 10/03/2026
70
Kostenlose Installationen

FZ Indicator for cTrader

Description

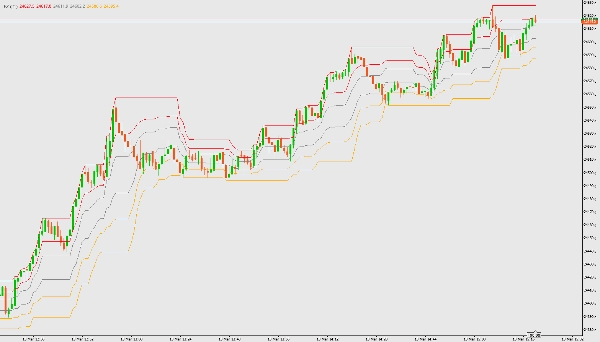
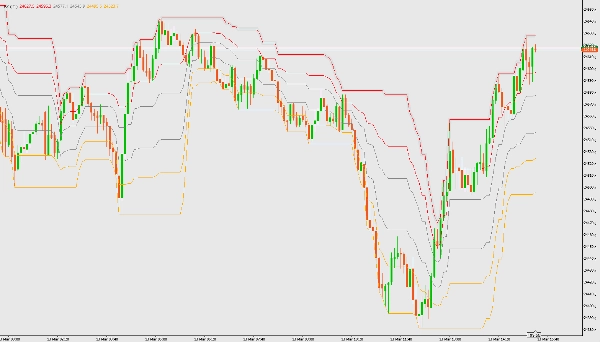
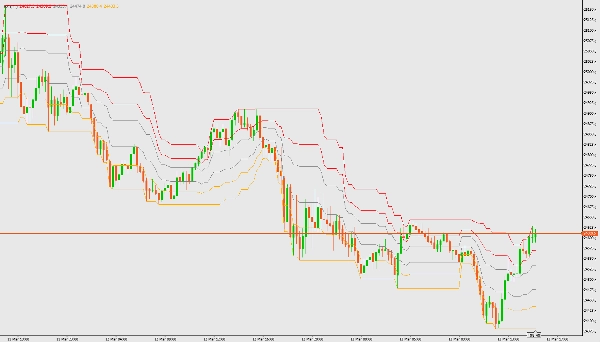
The FZ indicator draws Fibonacci channel zones based on the highest and lowest prices over a user-defined period. It helps identify trend zones and potential reversal areas.

Features

  • Calculates channel borders and Fibonacci levels (0.236, 0.382, 0.618, 0.786)
  • Visualizes uptrend, ranging, and downtrend zones
  • Overlay on price chart

Parameters

  • calculate for last ## bars: Number of bars to use for calculation (default: 21)

How to Use

  1. Download and add the FZ indicator file (FZ.cs) to your cTrader platform.
  2. Compile the indicator in cTrader Automate.
  3. Attach the indicator to any chart.
  4. Adjust the parameter for the number of bars as needed.
  5. Interpret the colored zones:
    • Cyan: Uptrend zone (go long)
    • Gray: Ranging zone (wait for trend change)
    • Orange: Downtrend zone (go short)
Indicator profile
0.0
Bewertungen: 0
Kundenbewertungen
Bisher gibt es keine Bewertungen für dieses Produkt. Haben Sie es schon ausprobiert? Dann können Sie die erste Person sein, die andere darüber informiert!
BTCUSD
Forex
Signal
Breakout
Indices
EURUSD
Commodities
GBPUSD
NZDUSD
Prop
Scalping
Crypto
Grid
AI
Stocks
XAUUSD
NAS100
USDJPY
Products available through cTrader Store, including trading bots, indicators and plugins, are provided by third-party developers and made available for informational and technical access purposes only. cTrader Store is not a broker and does not provide investment advice, personal recommendations or any guarantee of future performance.

Mehr von diesem Autor

Sero is a stochastic-based momentum oscillator that gives clear, color-coded visual signals for market momentum shifts.

Das könnte Sie auch noch interessieren

📊 Smart Floating Risk Ultimate.Transform Your Risk Management with Real-Time Intelligence.
Bússola para Decisões de Trading Precisas e Eficientes!
Enhance the trading experience with real-time Spread, Time To Close, rPNL, uPNL, PNL and minimalistic Bid / Ask lines
Identify and trade breakouts with Consolidation Zones! Visualize price consolidation areas for trading opportunities.
SUPER TREND OSCILLATOR TRIAL DAY15
MCDX is a powerful and innovative indicator.
MARainbow gives you the edge with four customizable moving averages—each color-coded for instant recognition.
HMA MTF Hull Moving AverageMulti Timeframe
SSL Channel: Tracks trends 📈 measures volatility ⚡filters noise via ATR+SSL. Clear signals for precise entries/exit...
Block Liquidity,indicator.Block Order, Liquids Stops, Signal Sentiment,signal correction
An intelligent chandelier-style trailing stop that flips when price breaks the opposite stop.
DRBC Levels — Professional Smart Money Trading Zones with Draggable Ranges, Premium/Discount Alerts & 200-Bar Backtest.
E7 Correlation Dashboard.
MultiFrameCandles para cTrader: La Herramienta Definitiva para Dominar Cualquier Marco de Tiempo
Smart Support/Resistance lines auto calculated from D1/H4/H1/M15. Highly customizable visuals + built in Backtest Mode.
Real-time multi-asset correlation matrix with 5 themes, Δ% performance tracking, and full customization. Up to 12 symbol
Professional fair value gap detection with multi-timeframe insight, CE tracking, and clean institutional-grade visuals.
A Fair Value Gap (FVG) indicator that identifies potential price imbalances, potential reversal and continuation zones
Seit 10/03/2026
70
Kostenlose Installationen