
Description
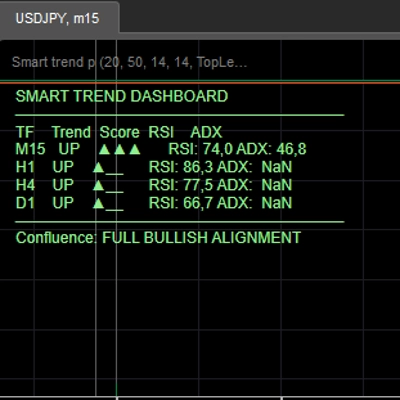
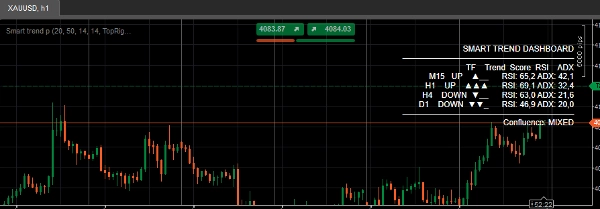
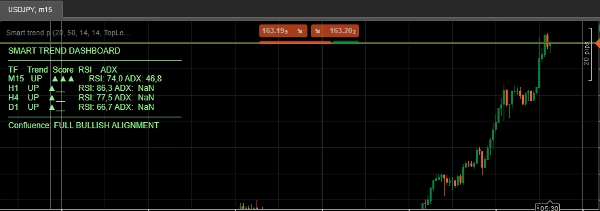
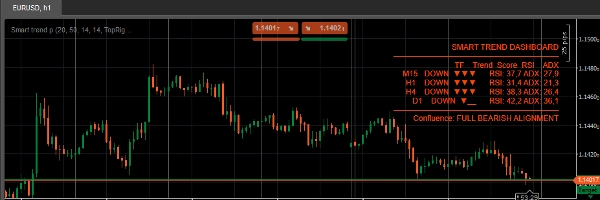
Stop flipping between chart timeframes to check if your trend actually holds up. Smart Trend Dashboard scans M15, H1, H4, and D1 simultaneously and gives you a single composite score per timeframe (-3 to +3) that blends EMA direction, DI+/DI- confirmation, and RSI momentum — with ADX filtering out weak, choppy trends so you're not fooled by noise.
Key Features:
- Live multi-timeframe panel (M15 / H1 / H4 / D1) directly on your chart
- Composite trend score per timeframe — one number, not four indicators to interpret
- Visual strength bars (▲▲▲ / ▼▼_) for instant read at a glance
- ADX-gated scoring — weak/choppy trends are automatically dampened
- Full confluence detection — flags when all timeframes agree
- Sound alert when full bullish/bearish alignment happens
- Color-coded panel (green = bullish alignment, red = bearish, white = mixed)
- Lightweight — no repainting, updates on bar close
Who it's for:
Discretionary traders and semi-automated system builders who use multi-timeframe confirmation before entering trades, and want that check automated instead of manual.
Summary
AI summary
Smart Trend Dashboard is a multi-timeframe indicator for cTrader that evaluates trend direction, momentum, and strength across four timeframes: M15, H1, H4, and D1. It provides a composite trend score ranging from -3 to +3 per timeframe, integrating EMA direction, DI+/DI- confirmation, and RSI momentum, while using ADX to filter out weak or choppy trends. The dashboard displays these scores visually with strength bars and color-coded panels (green for bullish, red for bearish, white for mixed), enabling quick assessment of market conditions without switching chart timeframes.
Key features include a live panel directly on the chart, ADX-gated scoring to reduce noise, full confluence detection that flags when all timeframes align, and sound alerts for complete bullish or bearish alignment. The indicator updates on bar close and does not repaint, making it suitable for discretionary traders and semi-automated system builders who rely on multi-timeframe confirmation before entering trades.
Key features include a live panel directly on the chart, ADX-gated scoring to reduce noise, full confluence detection that flags when all timeframes align, and sound alerts for complete bullish or bearish alignment. The indicator updates on bar close and does not repaint, making it suitable for discretionary traders and semi-automated system builders who rely on multi-timeframe confirmation before entering trades.
Indicator profile
Indicator category
Trend
Output type
Visualisation
Signals
Data requirements
Bars only
Supported signals
Trend strength
Customer reviews
0.0
Reviews: 0
Customer reviews
No reviews for this product yet. Already tried it? Be the first to tell others!
Discussion
FAQ
ADX
EMA
Supertrend
SMA
RSI
Moving Average
Products available through cTrader Store, including trading bots, indicators and plugins, are provided by third-party developers and made available for informational and technical access purposes only. cTrader Store is not a broker and does not provide investment advice, personal recommendations or any guarantee of future performance.
More from this author


















Price
Since 30/05/2026
1
Sales