
ICT HTF Candles_Majob
Indicator
Version 1.0, Jan 2026
Windows, Mac
4.0
Reviews: 1
Description
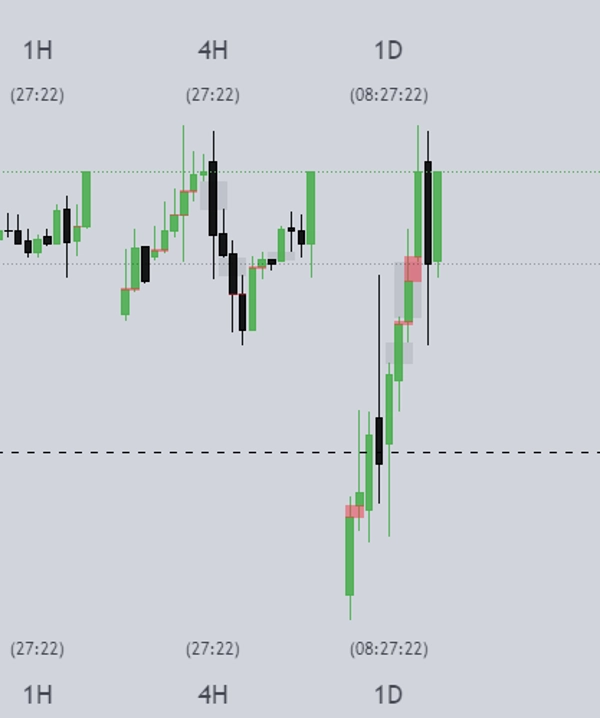
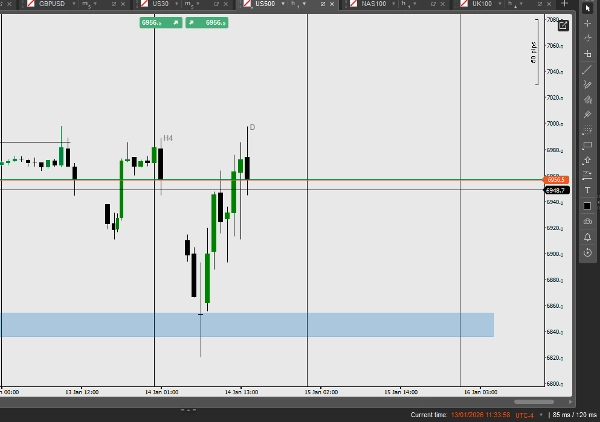
ICT HTF Candles - The Ultimate Multi-Timeframe Dashboard
Stop switching timeframes and losing focus. ICT HTF Candles projects higher timeframe price action directly onto your chart in a clean, non-intrusive dashboard.
Key Features:
- Smart Zooming: Candles scale perfectly when you zoom in or out. No more distorted blocks.
- Auto-Hiding: Automatically hides lower timeframes that aren't relevant to your current view.
- Context-Aware: Displays up to 5 different timeframes side-by-side.
- Fully Customizable: Change colors, spacing, wicks, and opacity to match your trading style.
- Zero Lag: Optimized code draws only on the last bar for maximum performance.
Summary
AI summary
ICT HTF Candles is a multi-timeframe dashboard indicator designed to display higher timeframe price action directly on your current chart. It eliminates the need to switch between timeframes, helping traders maintain focus. The indicator supports up to five different timeframes shown side-by-side in a clean, non-intrusive layout.
Key features include smart zooming, which ensures candle visuals scale correctly without distortion when zooming in or out. It also offers auto-hiding of lower timeframes that are irrelevant to the current view, enhancing chart clarity. The dashboard is context-aware and fully customizable, allowing users to adjust colors, spacing, wick display, and opacity to suit their trading preferences. The code is optimized for zero lag by drawing only on the last bar, ensuring smooth performance.
ICT HTF Candles supports various markets and symbols including Forex pairs (EURUSD, GBPUSD, NZDUSD, USDJPY), cryptocurrencies (BTCUSD), commodities (XAUUSD), indices (NAS100), and stocks. It is applicable for multiple trading strategies such as breakout, scalping, martingale, grid, and smart money concepts.
Indicator profile
Customer reviews
4.0
Reviews: 1
5 | 0 % | |
4 | 100 % | |
3 | 0 % | |
2 | 0 % | |
1 | 0 % |
Customer reviews
January 24, 2026
a 5 minute check should not become a 30 minute rabbit hole, and the journal gets fewer messy entries.
Discussion
FAQ
BTCUSD
Forex
Signal
Breakout
Indices
EURUSD
Commodities
GBPUSD
NZDUSD
Martingale
Prop
Scalping
SMC
Crypto
Grid
Stocks
AI
XAUUSD
NAS100
USDJPY
Products available through cTrader Store, including trading bots, indicators and plugins, are provided by third-party developers and made available for informational and technical access purposes only. cTrader Store is not a broker and does not provide investment advice, personal recommendations or any guarantee of future performance.

!["[Hamster-Coder] Pivot Points MTF" logo](https://cdn.ctrader.com/image/webp/4c143e5a-309c-40e3-a578-f04d1e133ffa_31159)


Price
Since 08/01/2026
1
Sales