

Opis
FIXED RANGE VOLUME PROFILE (FRVP)
Automatycznie wykrywający wskaźnik profilu wolumenu
--------------------------------------------------
Rozkład wolumenu. Obszary wartości. Węzły o wysokim wolumenie. Wszystko z Twojej linii trendu.
--------------------------------------------------
CO ROBI TEN WSKAŹNIK
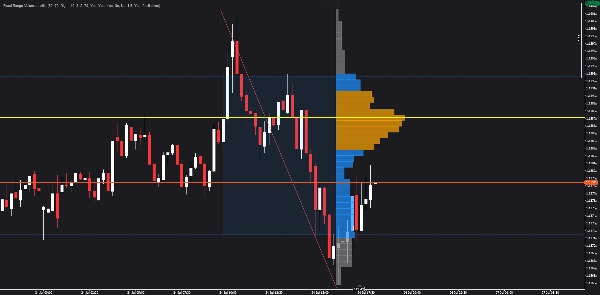
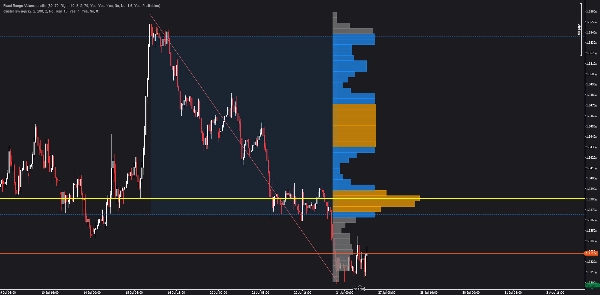
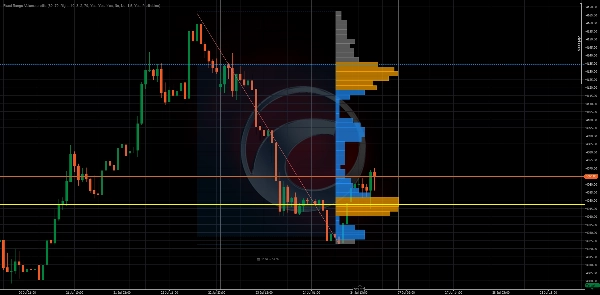
Fixed Range Volume Profile (FRVP) wyświetla rozkład wolumenu na zakresie zdefiniowanym przez użytkownika — automatycznie wykrywając najnowszą linię trendu, którą narysujesz na wykresie.
Nie jest potrzebny ręczny wybór zakresu. Wystarczy narysować linię trendu, a profil pojawi się automatycznie.
--------------------------------------------------
KLUCZOWE CECHY
- AUTOMATYCZNIE WYKRYWA najnowszą linię trendu (bez potrzeby ręcznego nazewnictwa)
- Punkt Kontroli (POC) - najwyższy poziom wolumenu
- Obszar wartości (VAH + VAL) - konfigurowalny procent (domyślnie 70%)
- Węzły o wysokim wolumenie (HVN) - wolumen powyżej średniego progu
- Wyświetlanie histogramu (po lewej lub prawej stronie zakresu)
- Konfigurowalne wiersze (od 10 do 200)
- Możliwość dostosowania kolorów i przezroczystości
- Rozszerzanie linii w prawo
- Pokazywanie/ukrywanie etykiet cen
- Brak przemalowywania
--------------------------------------------------
JAK TO DZIAŁA
1. Narysuj linię trendu na wykresie
2. Wskaźnik automatycznie ją wykrywa
3. Profil wolumenu jest obliczany na podstawie zakresu
4. Wyświetlane są POC, VAH, VAL i HVN
Nie jest wymagane nazewnictwo. Nie ma ręcznego wyboru zakresu.
--------------------------------------------------
ELEMENTY WIZUALNE
- Żółta linia pozioma = Punkt Kontroli (POC)
- Niebieskie przerywane linie = Wysoki Obszar Wartości (VAH) i Niski Obszar Wartości (VAL)
- Pomarańczowe słupki = Węzły o wysokim wolumenie (HVN)
- Szare słupki = Węzły o niskim wolumenie
- Zacieniony obszar = Obszar wartości (70% wolumenu)
- Histogram = Rozkład wolumenu według poziomu cen
--------------------------------------------------
PRZEGLĄD PARAMETRÓW
USTAWIENIA PROFILU:
- Liczba wierszy: Ile wierszy cenowych (10-200)
- Procent obszaru wartości: % wolumenu w obszarze wartości (1-100)
USTAWIENIA WIZUALNE:
- Strona profilu: Lewa lub prawa strona zakresu
- Szerokość histogramu %: Szerokość słupków histogramu
- Skalowanie szerokości słupków: Współczynnik skalowania szerokości słupków
- Minimalna szerokość słupka %: Minimalna szerokość słupka
- Przezroczystość słupków: Przezroczystość słupków (10-100)
KOLORY:
- Kolor POC
- Kolor obszaru wartości
- Kolor węzła o wysokim wolumenie
- Kolor niskiego wolumenu
WĘZŁY O WYSOKIM WOLUMENIE:
- Próg HVN: Mnożnik wolumenu kwalifikujący jako HVN
USTAWIENIA LINII TRENDU:
- Automatyczne wykrywanie najnowszej: Automatyczne znajdowanie najnowszej linii trendu
- Ręczna nazwa linii trendu: Określ nazwę (jeśli automatyczne wykrywanie wyłączone)
--------------------------------------------------
ZASTOSOWANIA
- Identyfikacja miejsc o największym wolumenie
- Znalezienie Punktu Kontroli (POC) dla wejść/wyjść
- Użycie obszaru wartości (VAH/VAL) jako celów zysku
- Wykrywanie węzłów o wysokim wolumenie (HVN) dla kluczowych poziomów
- Szybkie zrozumienie rozkładu wolumenu
- Łączenie z innymi wskaźnikami dla potwierdzenia
--------------------------------------------------
AKTUALIZACJA DO STRUCTURAL HEAT ZONES
Ten wskaźnik pokazuje rozkład wolumenu.
Structural Heat Zones idzie dalej — mapuje intensywność uczestnictwa, akceptację vs odrzucenie oraz zaangażowanie rynku w wielu strefach.
Szukaj Structural Heat Zones w sklepie cTrader.
--------------------------------------------------
AKTUALIZACJA DO INVICTUS EA
Invictus EA wykorzystuje technologię strukturalną do wykonywania automatycznych transakcji.
Szukaj Invictus w sklepie cTrader.
--------------------------------------------------
NOTATKI TECHNICZNE
- Nakładka wskaźnika
- Działa na dowolnym interwale czasowym i symbolu
- Brak przemalowywania (obliczenia historyczne)
- Optymalizacja pod kątem wydajności
--------------------------------------------------
WSPARCIE
Aktualizacje dożywotnie w cenie.
DLA WIĘCEJ INFORMACJI - Kliknij profil dewelopera poniżej.





























