
Opis
STREFY STRUKTURALNEGO CIEPŁA
Mapa Intensywności Udziału
--------------------------------------------------
Zobacz, gdzie cena walczy. Zobacz, gdzie ją ignoruje.
Większość narzędzi wsparcia/oporu rysuje linie tam, gdzie cena BYŁA.
Strefy Strukturalnego Ciepła odpowiadają na pytanie: Czy rynek naprawdę ZWRACA UWAGĘ na ten poziom?
--------------------------------------------------
OCENA INTENSYWNOŚCI CIEPŁA (0 do 100)
Wskaźnik analizuje skupiska swingów i przypisuje ocenę ciepła:
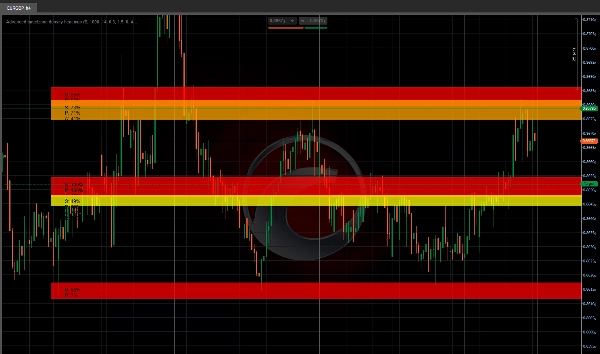
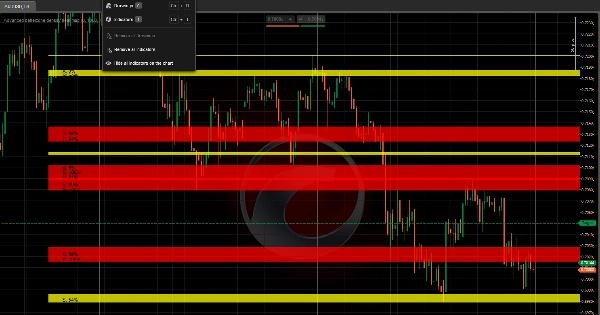
- Czerwone strefy (ciepło 80 do 100) = Najsilniejszy udział strukturalny
- Pomarańczowe strefy (ciepło 60 do 80) = Aktywna strefa strukturalna
- Żółte strefy (ciepło 40 do 60) = Umiarkowane zainteresowanie
- Niebieskie strefy (poniżej 40 ciepła) = Słaba struktura
Wyższe ciepło = więcej skupionych swingów = większa uwaga rynku.
--------------------------------------------------
ŚLEDZENIE AKCEPTACJI VS ODRZUCENIA
Dla każdej strefy strukturalnego ciepła wskaźnik śledzi zachowanie ceny:
- AKCEPTACJA = Cena zamyka się wewnątrz strefy (zachowanie wsparcia)
- ODRZUCENIE = Cena zostawia długie knoty przy strefie (zachowanie oporu)
To mówi, czy strefa prawdopodobnie UTRZYMA się lub ODWRÓCI.
--------------------------------------------------
ANALIZA ZAANGAŻOWANIA RYNKU
System mierzy:
- Dotknięcia świec (jak często cena odwiedza każdą strefę)
- Zamknięcia wewnątrz (wskaźnik akceptacji)
- Odrzucenia knotów (wskaźnik odrzucenia)
- Konfigurowalny okres analizy wstecznej
Niskie zaangażowanie = słaba strefa. Wysokie zaangażowanie = strefa strukturalnego ciepła.
--------------------------------------------------
WIZUALNE MAPOWANIE INTENSYWNOŚCI
- Strefy kodowane kolorami według oceny ciepła (czerwony = najgorętszy)
- Rozszerzenia halo dla wizualizacji odrzucenia
- Etykiety danych pokazujące: Ciepło / Udział / Akceptację / Odrzucenie
- Automatyczne czyszczenie (strefy rysują się automatycznie)
- Opcjonalne strzałki swing high/low
--------------------------------------------------
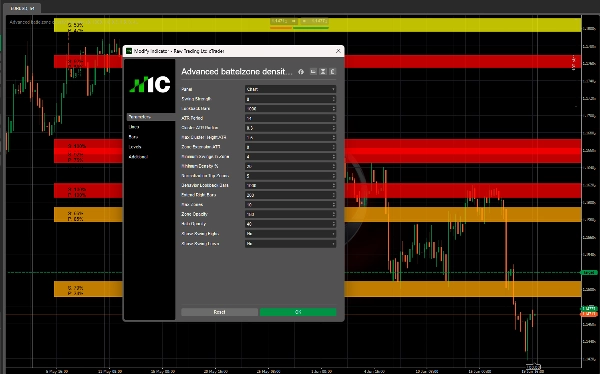
KLUCZOWE PARAMETRY
- Siła Swingu: Czułość punktu zwrotnego (wyższa = mniej swingów)
- Liczba świec wstecz: Jak daleko wstecz wykrywać swingi
- Okres ATR: Do adaptacyjnego obliczania promienia
- Promień skupiska ATR: Jak blisko muszą być swingi, by się skupiać
- Maksymalna wysokość skupiska ATR: Odrzuca strefy szersze niż ta
- Rozszerzenie strefy ATR: Rozmiar halo do wykrywania odrzucenia
- Minimalna liczba swingów w strefie: Minimalny rozmiar skupiska
- Minimalna ocena ciepła: Pokazuje tylko strefy powyżej tej wartości
- Liczba świec do analizy zachowania: Okres śledzenia zaangażowania
- Maksymalna liczba stref: Maksymalna liczba wyświetlanych stref
- Przezroczystość strefy / halo: Przezroczystość wizualna
--------------------------------------------------
ZASTOSOWANIA
- Znajdź prawdziwe strefy strukturalnego ciepła (wysokie ciepło + wysokie zaangażowanie)
- Rozróżnij strefy akceptacji od stref odrzucenia
- Unikaj obszarów o niskim cieple i niskim udziale
- Identyfikuj skupiska strukturalne do ustalania wejścia i wyjścia
- Konfluencja z wskaźnikami trendu lub przepływem zleceń
--------------------------------------------------
NOTATKI TECHNICZNE
- Nakładka wskaźnika (rysuje na wykresie cenowym)
- Działa na dowolnym interwale i symbolu
- Automatycznie dostosowuje się do zmienności przez ATR
- Brak przemalowywania (swingi są historyczne)
--------------------------------------------------
OD TWÓRCÓW INVICTUS EA
Strefy Strukturalnego Ciepła wykorzystują tę samą technologię udziału strukturalnego, co zautomatyzowany system handlowy Invictus.
--------------------------------------------------
UJAWNIENIE RYZYKA
Ten wskaźnik jest narzędziem analitycznym. Nie generuje automatycznych sygnałów handlowych. Wszystkie decyzje handlowe pozostają w gestii użytkownika.
--------------------------------------------------
WSPARCIE
Dożywotnie aktualizacje w cenie.
DLA WIĘCEJ INFORMACJI - Kliknij profil dewelopera poniżej.
Podsumowanie
Key features include color-coded heat zones, halo extensions for rejection visualization, and data labels displaying heat, participation, acceptance, and rejection scores. The system measures candle touches, closes inside zones, and wick rejections over a configurable lookback period to quantify market engagement. Adjustable parameters allow customization of swing sensitivity, cluster radius, zone size, and visual opacity.
This tool supports any timeframe and symbol, adapts to volatility using ATR, and does not repaint historical swings. It is intended for identifying genuine structural heat zones, differentiating acceptance from rejection areas, and aiding entry and exit placement in conjunction with other trend or order flow indicators. The indicator is analytical and does not generate automated trading signals.
Opinie klientów
5 | 100 % | |
4 | 0 % | |
3 | 0 % | |
2 | 0 % | |
1 | 0 % |


![Logo „[Hamster-Coder] Bollinger Bands”](https://cdn.ctrader.com/image/webp/21d8e5d6-fb11-4bac-b9ee-cd05c2b76804_30327)
