
Consolidation Zones
Wskaźnik
1 zakupy
Wersja 1.0, Oct 2025
Windows, Mac
4.0
Opinie: 1
Opis
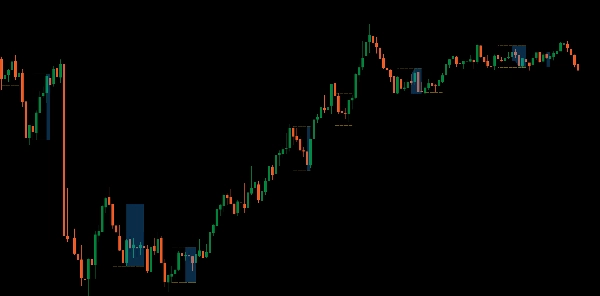
Przedstawiamy wskaźnik Stref Konsolidacji, zaprojektowany, aby pomóc Ci łatwo identyfikować i wykorzystywać okazje do wybicia.
To potężne narzędzie podkreśla na Twoim wykresie strefy, w których cena konsoliduje się, co ułatwia dostrzeżenie potencjalnych punktów wybicia. Dzięki wizualizacji tych kluczowych obszarów możesz lepiej przewidywać ruchy rynku i podejmować bardziej świadome decyzje handlowe.
Idealny dla traderów chcących wzbogacić swoją strategię o jasne i praktyczne wskazówki, ulepsz swój zestaw narzędzi handlowych i opanuj wybicia dzięki wskaźnikowi Stref Konsolidacji.
Podsumowanie
Podsumowanie AI
The Consolidation Zones indicator identifies and visualizes price consolidation areas on trading charts to help traders spot potential breakout points. By highlighting these zones, it assists in anticipating market movements and supports more informed decision-making. This tool is applicable across multiple markets, including Forex, cryptocurrencies (e.g., BTCUSD), commodities (e.g., gold, oil), indices (e.g., NAS100, SP500), and stocks. It is designed to enhance trading strategies focused on breakout opportunities by providing clear visual cues of consolidation phases.
Profil wskaźnika
Opinie klientów
4.0
Opinie: 1
5 | 0 % | |
4 | 100 % | |
3 | 0 % | |
2 | 0 % | |
1 | 0 % |
Opinie klientów
October 12, 2025
Two timeframes give more context, and the log becomes easier to read.
Dyskusja
Częste pytania
BTCUSD
Forex
Breakout
Indices
EURUSD
Commodities
GBPUSD
NZDUSD
Prop
Crypto
Stocks
XAUUSD
NAS100
USDJPY
Produkty dostępne za pośrednictwem cTrader Store, w tym boty handlowe, wskaźniki i wtyczki, dostarczane są przez deweloperów zewnętrznych i udostępniane wyłącznie w celach informacyjnych oraz w celu zapewnienia dostępu technicznego. cTrader Store nie jest brokerem i nie zapewnia doradztwa inwestycyjnego, nie udziela spersonalizowanych rekomendacji ani nie gwarantuje przyszłych wyników.


Cena
Od 25/09/2025
25
Sprzedaż
315
Bezpłatne instalacje