
ATR Bands
Wskaźnik
5 zakupy
Wersja 1.0, Oct 2025
Windows, Mac
4.6
Opinie: 3
Opis
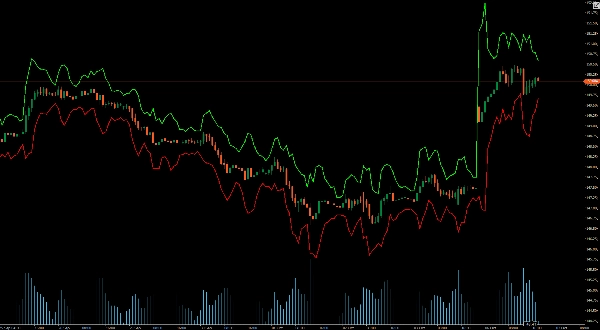
ATR Bands dynamicznie wyświetla górne i dolne pasma na Twoich wykresach cenowych.
Te pasma oferują wgląd w czasie rzeczywistym w zmienność rynku, pomagając precyzyjnie identyfikować potencjalne punkty wybicia i odwrócenia. Idealne dla traderów na każdym poziomie, ATR Bands usprawniają proces podejmowania decyzji, dostarczając wyraźne wskazówki wizualne do ustawiania stop-lossów, take-profitów oraz optymalizacji punktów wejścia.
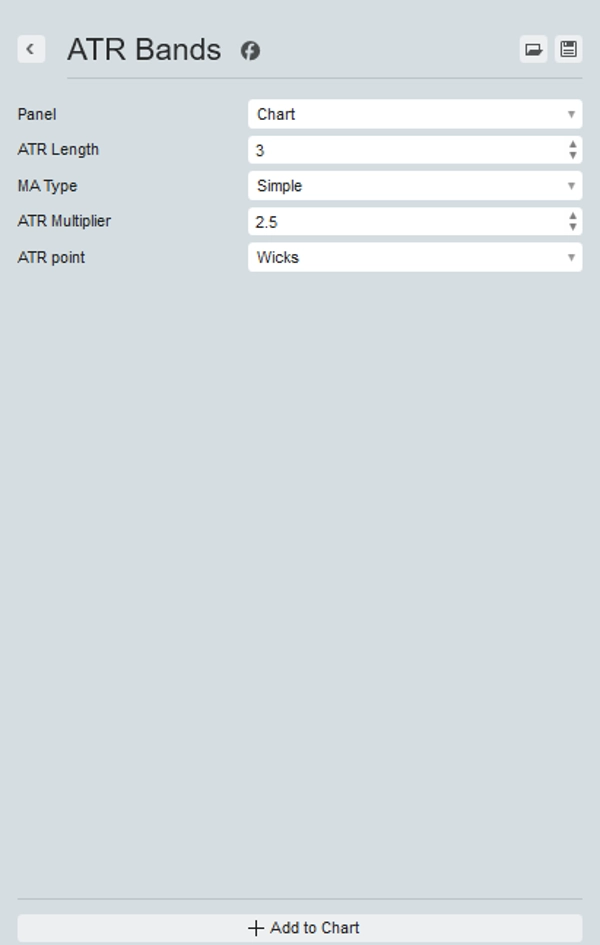
Ustawienia pozwalają wybrać preferowany okres i mnożnik, zmienić średnią kroczącą używaną do obliczania ATR oraz korzystać z knotów świec lub zamknięcia świecy.
Ulepsz swój zestaw narzędzi handlowych już dziś i doświadcz różnicy z ATR Bands – Twoją przewagą na rynku.
Podsumowanie
Podsumowanie AI
ATR Bands is a trading indicator that dynamically plots upper and lower bands on price charts based on the Average True Range (ATR). These bands provide real-time visualization of market volatility, assisting traders in identifying potential breakout and reversal points. The indicator supports customizable settings, including the choice of period and multiplier, selection of the moving average type used to calculate ATR, and the option to base calculations on candle wicks or candle closes. ATR Bands are applicable across various markets such as Forex, cryptocurrencies (e.g., BTCUSD), commodities, indices, and stocks. By offering clear visual cues, this tool aids in optimizing entry points, as well as setting stop-loss and take-profit levels.
Profil wskaźnika
Opinie klientów
4.6
Opinie: 3
5 | 67 % | |
4 | 33 % | |
3 | 0 % | |
2 | 0 % | |
1 | 0 % |
Opinie klientów
October 19, 2025
weak entries have a harder time slipping through, but risk control still needs say no.
October 14, 2025
The better read comes from there is a useful pause before the click, and a few signals across sessions tell more.
October 13, 2025
Dyskusja
Częste pytania
BTCUSD
Forex
Breakout
Indices
EURUSD
Commodities
GBPUSD
NZDUSD
Prop
Crypto
Stocks
XAUUSD
NAS100
ATR
USDJPY
Produkty dostępne za pośrednictwem cTrader Store, w tym boty handlowe, wskaźniki i wtyczki, dostarczane są przez deweloperów zewnętrznych i udostępniane wyłącznie w celach informacyjnych oraz w celu zapewnienia dostępu technicznego. cTrader Store nie jest brokerem i nie zapewnia doradztwa inwestycyjnego, nie udziela spersonalizowanych rekomendacji ani nie gwarantuje przyszłych wyników.


Cena
Od 25/09/2025
25
Sprzedaż
315
Bezpłatne instalacje