
session indicator
Wskaźnik
7 zakupy
Wersja 1.0, May 2025
Windows, Mac
4.3
Opinie: 3
Wizualizuj kluczowe sesje rynkowe + poziomy maksymalne/minimalne z precyzją
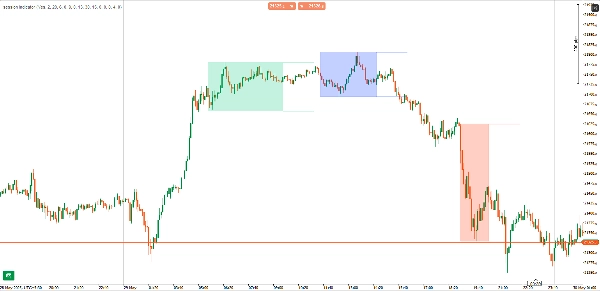
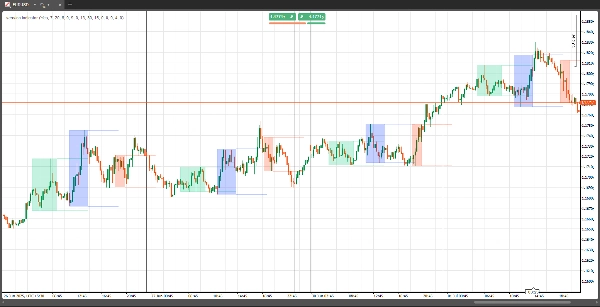
Wskaźnik sesji handlowych wyróżnia najważniejsze sesje handlowe — Londyn, Nowy Jork i Tokio — bezpośrednio na twoim wykresie. Niezależnie od tego, czy jesteś skalperem, czy traderem swingowym, wiedza o tym, kiedy zmienność rośnie lub maleje, jest kluczowa. To narzędzie zapewnia tę przewagę z jasnością.
✅ Kluczowe funkcje:
- Prostokąty sesji: Wizualne wyróżnienie każdej sesji za pomocą opcjonalnych zacienionych pól
- Linie maks./min.: Rysowanie maksimów i minimów sesji z dostosowywaną długością przedłużenia
- Widok historyczny: Przegląd danych sesji dla bieżącego dnia lub dowolnej liczby poprzednich dni
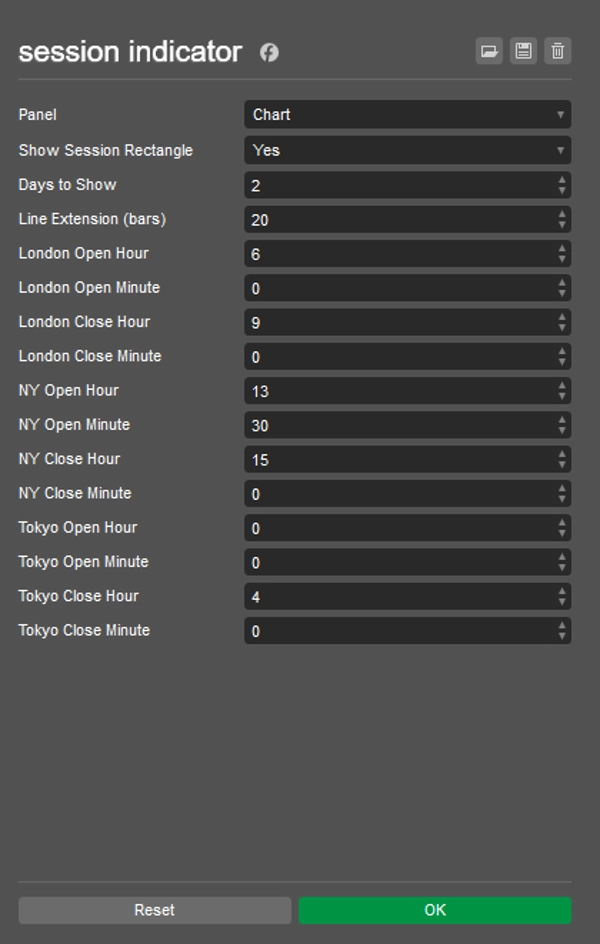
- W pełni konfigurowalny: Ustaw czas rozpoczęcia/zakończenia sesji, włącz/wyłącz prostokąty i określ, jak daleko linie się rozciągają
- Obsługa wielu interwałów czasowych: Działa na wszystkich interwałach wykresu
🔧 Parametry:
- Czasy sesji: Niestandardowy czas rozpoczęcia/zakończenia dla Londynu, NY i Tokio
- Pokaż prostokąt: Włącz/wyłącz zacienione pola sesji
- Liczba dni do wyświetlenia: Liczba historycznych dni do wyświetlenia danych sesji
- Przedłużenie linii (słupki): Kontrola, jak daleko linie maks./min. sesji rozciągają się na wykresie
🧠 Dlaczego warto używać?
Zrozumienie wzorców zmienności opartych na sesjach to podstawa handlu instytucjonalnego. Ten wskaźnik pomaga Ci:
- Czasować wejścia i wyjścia wokół kluczowych stref płynności
- Identyfikować maksima i minima sesji do strategii wybicia lub odwrócenia
- Wizualnie oddzielać nakładanie się sesji (np. Londyn–NY)
Profil wskaźnika
Kategoria wskaźnika
Struktura rynku (SMC)
Typ wyjścia
Wizualizacja
Wymagania dotyczące danych
Tylko słupki
Obsługiwane sygnały
Odwrócenie trendu
4.3
Opinie: 3
5 | 67 % | |
4 | 0 % | |
3 | 33 % | |
2 | 0 % | |
1 | 0 % |
Opinie klientów
June 2, 2025
Useful setup helper for traders who care about timing windows. It gives value around session timing, but the value depends on the trader's schedule. I would compare Asia range, London break and New York continuation before trusting it. The tool is most useful when it keeps the trader out of dead hours.
June 1, 2025
June 1, 2025
Decent trade support for session timing. it helps match setups with active market hours, especially when used for planning trades around active sessions. The session view is useful for London and New York, especially when checking the first 60 minutes. The tool is most useful when it keeps the trader out of dead hours.
Prop
Forex
Indices
Fair Value Gap
SMC
NAS100
Produkty dostępne za pośrednictwem cTrader Store, w tym boty handlowe, wskaźniki i wtyczki, dostarczane są przez deweloperów zewnętrznych i udostępniane wyłącznie w celach informacyjnych oraz w celu zapewnienia dostępu technicznego. cTrader Store nie jest brokerem i nie zapewnia doradztwa inwestycyjnego, nie udziela spersonalizowanych rekomendacji ani nie gwarantuje przyszłych wyników.


Od 30/05/2025
40
Sprzedaż