
설명
VolumeProfileSuite 은 cTrader용 고급 및 유연한 볼륨 프로파일 지표입니다.
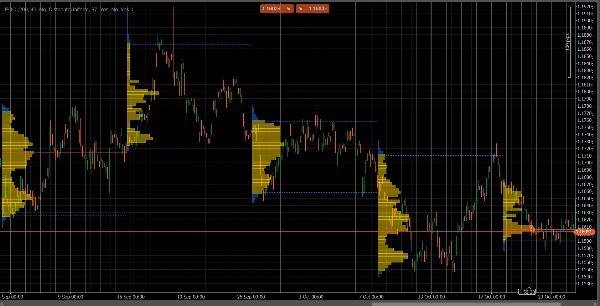
주요 목적은 다양한 가격 수준에서 거래 활동이 발생한 위치(즉, 거래량 분포)를 분석하여 "가치"(높은 거래량)와 "거부"(낮은 거래량) 영역을 식별하는 것입니다. 이를 통해 실제 시장 활동을 기반으로 가장 중요한 지지 및 저항 수준을 찾을 수 있습니다.
독특한 기능은 두 가지 강력한 분석 모드를 하나의 도구로 결합하여 Profile Mode 매개변수를 통해 선택할 수 있다는 점입니다:
FixedRange모드: 매크로 분석에 적합합니다. 사용자가 선택한 단일 큰 블록(예: 최근 1000개 바 또는 특정 날짜 범위, 예: "지난 주 전체")을 분석할 수 있습니다. 주요 장기 지지/저항 수준을 찾기에 이상적입니다.Periodic모드: 마이크로 및 행동 분석에 적합합니다. 자동으로 "N" 바마다(예: 매 100 바마다) 새 프로파일을 그립니다. 이를 통해 POC 및 가치 영역이 시간에 따라 어떻게 변하는지 보고 시장의 반복 패턴을 연구할 수 있습니다.- 매개변수 가이드 (영어)
새 통합 VolumeProfileSuite 지표에 대한 업데이트된 가이드입니다. 이 가이드는 선택한 모드에 따라 어떤 매개변수를 사용하고 어떤 매개변수를 무시해야 하는지 설명하므로 매우 중요합니다.
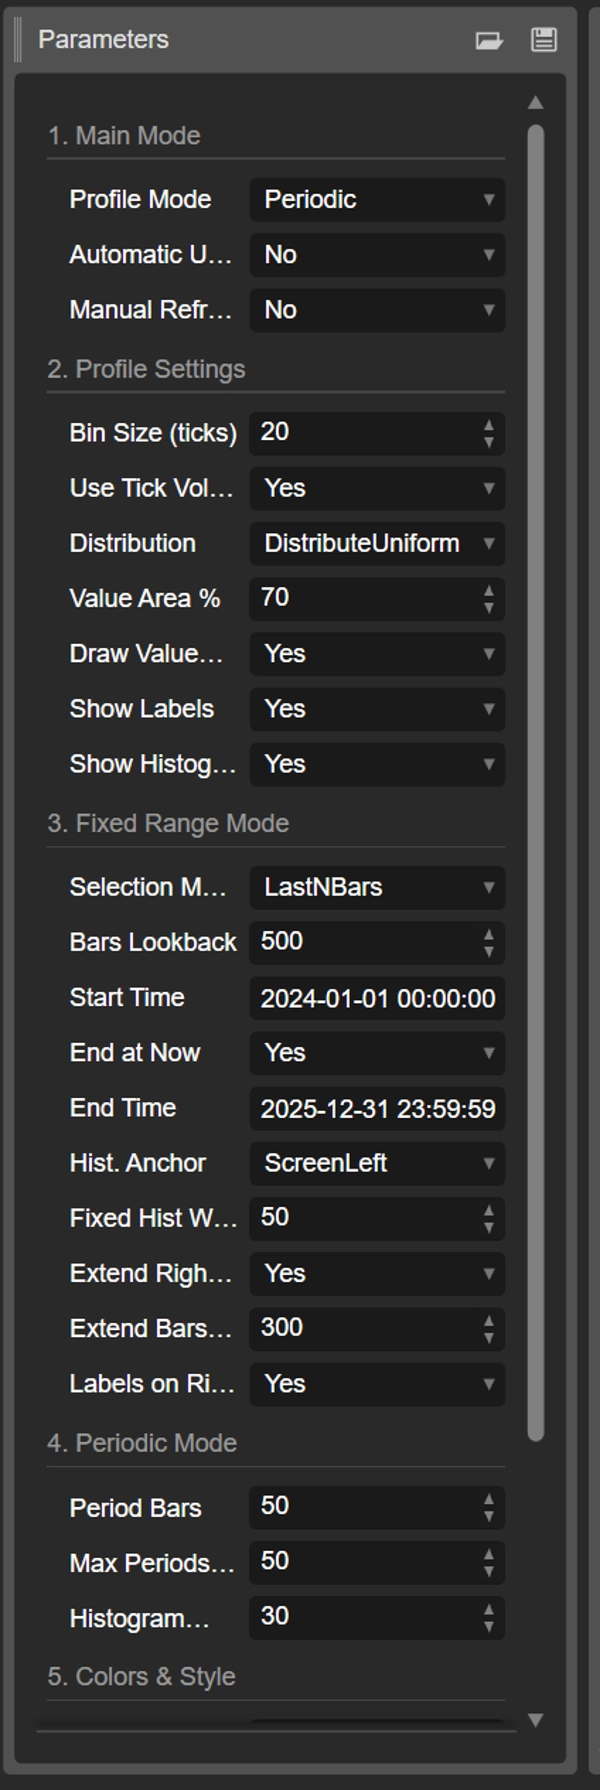
그룹 1: 주요 모드
- Profile Mode: 이것은 가장 중요한 매개변수이며 마스터 스위치 역할을 합니다.
-
FixedRange: "단일 블록" 모드를 활성화합니다. 지표는 사용자가 지정한 단 하나의 구간만 분석합니다(그룹 3 설정 사용).Periodic: "주기적" 모드를 활성화합니다. 지표는 자동으로 전체 차트를 블록 단위로 분석합니다(그룹 4 설정 기반).
중요:
FixedRange모드일 때는 "그룹 4: Periodic Mode"의 모든 매개변수를 무시해야 합니다.Periodic모드일 때는 "그룹 3: Fixed Range Mode"의 모든 매개변수를 무시해야 합니다.
그룹 2: 프로파일 설정
이 매개변수들은 공통이며 두 모드(FixedRange 및 Periodic)에 적용됩니다.
- Bin Size (틱): 프로파일의 수직 "해상도"를 제어합니다. 낮은 값(예:
1)은 매우 세밀한 얇은 가격 행을 많이 만듭니다. 높은 값(예:10)은 가격을 더 두꺼운 행으로 그룹화하여 덜 세밀하고 "더 부드럽게" 만듭니다. - 틱 거래량 사용:
true(권장)일 경우, 프로파일은 매우 정확한 실제 틱 거래량을 사용합니다.false일 경우, 각 바마다 단순히 "1"을 계산합니다. - 분포: 바의 거래량이 어떻게 분포되는지 정의합니다.
-
DistributeUniform(기본값): 바의 거래량을 저가부터 고가까지 닿은 모든 가격 수준에 "균등하게" 분포시킵니다.CloseOnly: 바의 거래량을 종가 가격에만 할당합니다.
- 가치 영역 %: "가치 영역"(가장 높은 거래 활동 영역)을 구성하는 거래량의 백분율을 설정합니다. 값
70(70%)은 시장 표준입니다. - 가치 영역 그리기 (VAH/VAL):
true일 경우, 가치 영역 상단 (VAH)과 가치 영역 하단 (VAL)의 수평선을 그립니다. - 레이블 표시:
true일 경우, 텍스트 레이블("POC", "VAH", "VAL")을 표시합니다. (주의:Periodic모드에서는 차트가 복잡해질 수 있습니다). - 히스토그램 표시:
true일 경우, 거래량 히스토그램(수평 막대)을 그립니다.
그룹 3: 고정 범위 모드
⚠️ "Profile Mode"가 FixedRange로 설정된 경우에만 이 매개변수를 사용하세요.
- 선택 모드: 단일 블록을 어떻게 정의할지 선택합니다.
-
DateRange: 특정 시작 및 종료 날짜/시간을 사용합니다.LastNBars: 최근 N개의 바를 사용합니다.
- 바 되돌아보기: (
LastNBars전용) 분석할 바의 수 (예:500). - 시작 시간 / 현재까지 종료 / 종료 시간: (
DateRange전용) 구간의 시작과 끝을 정의합니다. - 히스토그램 앵커: (
FixedRange전용) 히스토그램을 어디에 고정할지 정의합니다. -
DateRangeStart: 구간 시작 지점(화면 밖일 수 있음).ScreenLeft: 보이는 창의 왼쪽 가장자리.ScreenRight: 보이는 창의 오른쪽 가장자리(빈 공간에).
- 고정 히스토그램 너비 (바):
FixedRange모드의 히스토그램 너비(바 단위)입니다. - 오른쪽으로만 확장:
true일 경우, POC/VAH/VAL 선이 미래로 연장됩니다. - 확장 바 수: (
오른쪽으로만 확장이true일 때) 선을 얼마나 많은 바만큼 확장할지 설정합니다. - 오른쪽에 레이블 표시:
true일 경우, 확장된 선의 오른쪽 끝에 가격 레이블을 배치합니다.
그룹 4: 주기적 모드
⚠️ "Profile Mode"가 Periodic로 설정된 경우에만 이 매개변수를 사용하세요.
- 주기 바 수: 이 모드의 핵심 매개변수입니다. 각 주기적 블록에 포함할 바의 수를 정의합니다(예:
100). - 그릴 최대 주기 수: 🌟 안전 매개변수! cTrader가 충돌하지 않도록 주기적 프로파일 그리기 수를 제한합니다.
50는 기록이 더 많더라도 최근 50개 프로파일만 그린다는 의미입니다. 너무 높게 설정하지 마세요(예: 200 초과) 그렇지 않으면 cTrader가 멈출 수 있습니다! - 히스토그램 너비 (바): 각 주기적 블록의 히스토그램 너비(바 단위)입니다.
그룹 5: 색상 및 스타일
이 매개변수들은 공통이며 두 모드에 적용됩니다.
- POC 색상: 중심점 선의 색상입니다.
- VA 색상: VAH 및 VAL 선의 색상입니다.
- 선 두께: POC, VAH, VAL 선의 두께입니다.
- VA 히스토그램 색상: 가치 영역 내부의 히스토그램 막대 색상입니다(기본값: 노란색).
- 외부 히스토그램 색상: 가치 영역 외부의 히스토그램 막대 색상입니다(기본값: 파란색).
- 히스토그램 불투명도 %: 전체 히스토그램의 투명도(불투명도)입니다.
요약
고객 리뷰
5 | 50 % | |
4 | 50 % | |
3 | 0 % | |
2 | 0 % | |
1 | 0 % |


