Superior Trading Sessions Indicator cTrader
지표
1 구매
버전 1.0, Jun 2026
Windows, Mac
설명
Superior Trading Sessions 지표는 cTrader를 위해 네이티브로 구축된 순수 기술적 매핑 도구입니다. 주요 글로벌 거래 세션(아시아, 런던, 뉴욕, 프랑크푸르트)과 구조적 스마트 머니 개념(SMC) 요소를 자동으로 계산하고 시각화합니다. 가격 움직임을 복잡하게 하지 않으면서 유동성 풀과 구조적 목표를 추적하도록 설계되었습니다.
핵심 시각화
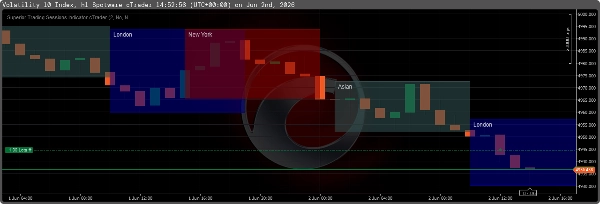
- 세션 사각형: 4개의 주요 거래 세션과 4개의 특정 고변동성 "킬존"을 조절 가능한 투명도와 선명한 실선 테두리로 매핑합니다.
- 전일 고가/저가 (PDH/PDL): 어제의 고가와 저가를 현재 실시간 거래일의 구조적 유동성 목표로 자동으로 표시합니다.
- 아시아 범위 예상: 아시아 고가와 저가에서 수평선을 16시간 앞으로 연장하여 런던과 뉴욕 겹침 기간 동안 유동성 스윕을 식별하는 데 도움을 줍니다.
- 세션 균형: 활성 세션을 통해 50% 중간선(균형선)을 그려 프리미엄과 할인 가격 영역을 객관적으로 결정합니다.
- 실시간 데이터: 활성 세션의 실시간 핍 크기와 세션 박스 모서리에 정확한 고가/저가 가격 라벨을 표시합니다.
- 혼잡 감소: 모든 과거 세션 박스를 완전히 숨기는 옵션을 포함하여 차트에는 현재 진행 중인 세션만 남깁니다.
입력 매개변수 설명
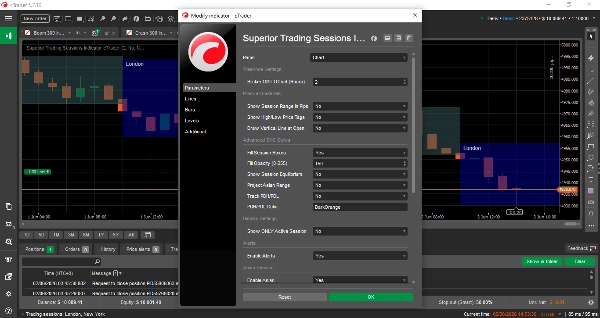
시간대 설정
- 브로커 GMT 오프셋: (정수) 브로커의 UTC/GMT 오프셋을 설정하세요. 이를 통해 표준 세션 시간이 브로커 서버 시간과 완벽하게 일치합니다.
프리미엄 기능
- 세션 범위를 핍 단위로 표시: (참/거짓) 세션 이름 라벨 옆에 세션의 전체 높이를 핍 단위로 표시합니다.
- 고가/저가 가격 태그 표시: (참/거짓) 세션 박스의 오른쪽 상단과 하단 모서리에 정확한 가격 수준을 출력합니다.
- 시작 시 수직선 그리기: (참/거짓) 세션 시작 캔들에 정확히 점선 수직선을 그립니다.
고급 SMC 스타일
- 세션 박스 채우기: (참/거짓) 참이면 사각형에 음영 배경이 있습니다. 거짓이면 사각형이 비어 있으며(테두리만 그림) 표시됩니다.
- 채우기 불투명도 (0-255): 세션 채우기의 투명도를 제어합니다. 낮은 값(예: 80)은 캔들스틱을 보이게 유지하고, 높은 값은 더 어둡고 풍부한 배경을 만듭니다.
- 세션 균형 표시: (참/거짓) 세션의 50% 되돌림 수준에 점선을 그립니다.
- 아시아 범위 예상: (참/거짓) 아시아 고가와 저가에서 하루 나머지 기간까지 수평 추세선을 예상합니다.
- PDH/PDL 추적: (참/거짓) 전일의 극단적 고가와 저가를 표시하는 실선 수평선을 그립니다.
- PDH/PDL 색상: 일일 유동성 선에 사용되는 색상을 정의합니다.
디스플레이 설정
- 활성 세션만 표시: (참/거짓) 참이면 지표가 모든 과거 드로잉을 삭제하고 현재 진행 중인 세션만 렌더링합니다.
알림 및 통지
- 알림 활성화: (참/거짓) 새로운 세션이 시작되는 정확한 순간에 네이티브 cTrader 도어벨 소리를 재생합니다.
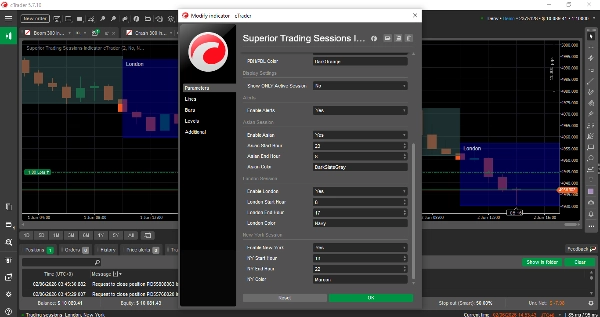
세션 시간
- [세션] 활성화: 주요 세션 가시성을 전환합니다.
- [세션] 시작/종료 시간: 주요 세션의 GMT 시작 및 종료 시간입니다.
- [세션] 색상: 해당 세션 박스, 텍스트 및 선에 적용되는 특정 색상입니다.
요약
AI 요약
The Superior Trading Sessions Indicator for cTrader is a technical charting tool that automatically maps major global trading sessions—Asian, London, New York, and Frankfurt—directly on your charts. It highlights key market periods known as "Killzones" with adjustable transparency and clear borders. The indicator plots previous day’s high and low prices as structural liquidity targets and extends Asian session range lines forward to assist in identifying liquidity sweeps during overlapping sessions.
It includes a session equilibrium line marking the 50% midpoint to help distinguish premium versus discount price zones. Real-time session pip ranges and exact high/low price labels are displayed for active sessions. Users can reduce chart clutter by showing only the current session’s data.
Configurable input parameters allow adjustment of broker GMT offset, session start/end times, colors, and display options such as filled or hollow session boxes, vertical lines at session open, and alert sounds at session start. Advanced Smart Money Concepts (SMC) features support tracking of liquidity pools and structural levels including previous day highs/lows and Asian range projections.
This indicator is designed to provide clear, structured visualization of key trading sessions and liquidity targets without obscuring price action, aiding traders in market timing and structural analysis.
지표 프로필
지표 카테고리
시장 구조 (SMC)
출력 유형
시각화
데이터 요구 사항
틱 데이터
막대만
지원되는 신호
시가 범위
고객 리뷰
0.0
리뷰: 0
고객 리뷰
이 상품에 대한 리뷰가 아직 없습니다. 이미 사용해 보셨나요? 다른 사람들에게 가장 먼저 소개해 주세요!
상담
자주 묻는 질문(FAQ)
Fibonacci
Premium/Discount
Key Levels
BOS
Liquidity Sweep
Support & Resistance
트레이딩 봇, 지표, 플러그인 등 cTrader Store에서 제공되는 상품은 제3자 개발자에 의해 제공되며, 이는 단순히 정보 및 기술적 접근을 목적으로 제공된 것입니다. cTrader Store는 중개인이 아니며, 투자 조언, 개인별 추천 또는 향후 성과에 대한 어떠한 보장도 제공하지 않습니다.