
설명
주요 시장 세션 및 고가/저가 수준을 정밀하게 시각화
트레이딩 세션 인디케이터는 가장 중요한 트레이딩 세션인 — 런던, 뉴욕, 그리고 도쿄 — 를 차트에 직접 표시합니다. 스캘퍼든 스윙 트레이더든 변동성이 급증하거나 감소하는 시점을 아는 것은 매우 중요합니다. 이 도구는 명확한 우위를 제공합니다.
✅ 주요 기능:
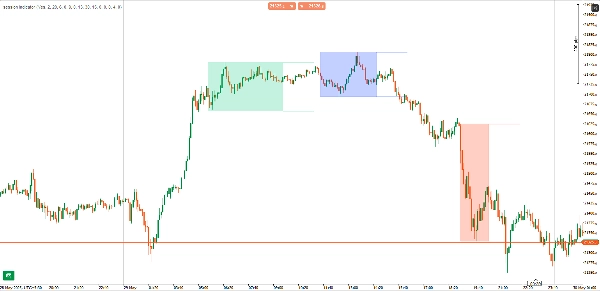
- 세션 사각형: 선택적 음영 박스로 각 세션을 시각적으로 강조 표시
- 고가/저가 선: 세션의 고가와 저가를 사용자 지정 확장 길이로 표시
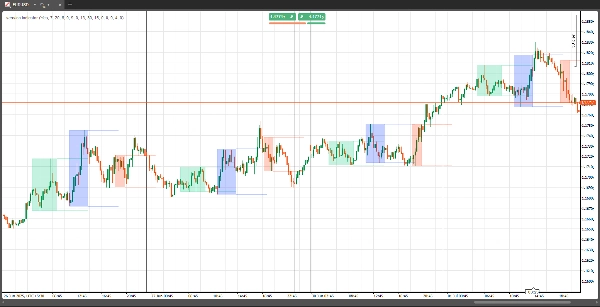
- 히스토리 뷰: 현재 일 또는 원하는 이전 일수의 세션 데이터를 확인
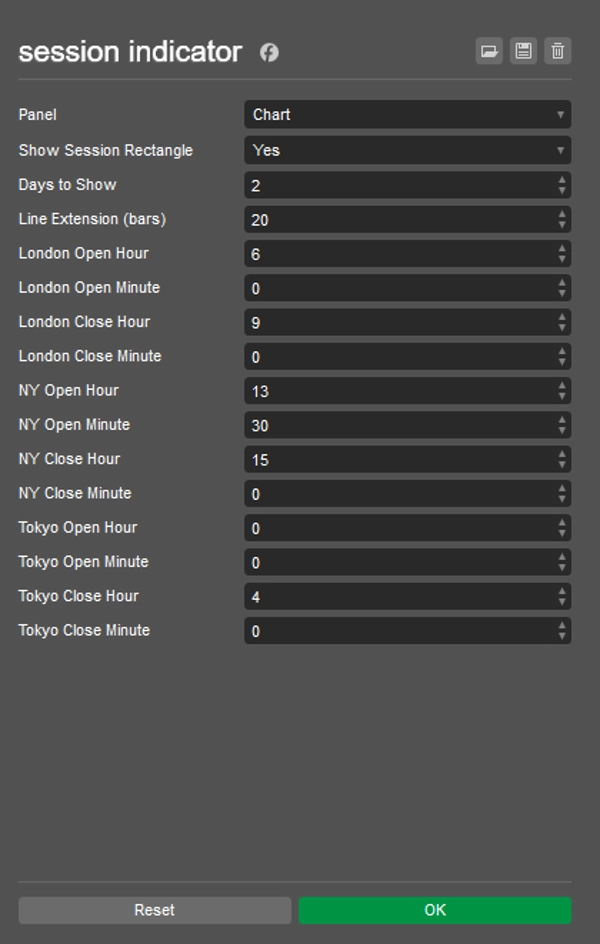
- 완전한 사용자 설정 가능: 세션 시작/종료 시간 설정, 사각형 표시 켜기/끄기, 선 확장 거리 정의
- 다중 타임프레임 지원: 모든 차트 타임프레임에서 작동
🔧 매개변수:
- 세션 시간: 런던, 뉴욕, 도쿄의 사용자 지정 시작/종료 시간
- 사각형 표시: 음영 처리된 세션 박스 토글
- 표시할 일수: 세션 데이터를 표시할 과거 일수
- 선 확장 바: 차트에서 세션 고가/저가 선이 확장되는 거리 제어
🧠 왜 사용해야 하나요?
세션 기반 변동성 패턴을 이해하는 것은 기관 거래의 핵심입니다. 이 인디케이터는 다음을 도와줍니다:
- 주요 유동성 구역 주변에서 진입 및 청산 시점 타이밍
- 돌파 또는 반전 전략을 위한 세션 고가 및 저가
- 세션 중첩 구간을 시각적으로 구분 (예: 런던–뉴욕)
요약
AI 요약
The Session Indicator is a charting tool designed to highlight key global trading sessions—London, New York, and Tokyo—directly on trading charts. It visually marks each session with optional shaded rectangles and plots session high and low price levels, with customizable line extension lengths. Users can view session data for the current day or multiple previous days, supporting analysis across various timeframes.
Key features include full customization of session start and end times, toggling of session rectangles, and control over how far high/low lines extend. The indicator works on all chart timeframes and helps traders identify volatility patterns associated with institutional trading sessions.
This tool aids in timing entries and exits around key liquidity zones, recognizing session highs and lows for breakout or reversal strategies, and visually distinguishing overlapping sessions such as London-New York. It supports markets including Forex, indices, and major symbols like NAS100. The indicator outputs visual signals based on market structure concepts and is suitable for traders employing reversal strategies.
지표 프로필
지표 카테고리
시장 구조 (SMC)
출력 유형
시각화
데이터 요구 사항
막대만
지원되는 신호
반전
고객 리뷰
4.3
리뷰: 3
5 | 67 % | |
4 | 0 % | |
3 | 33 % | |
2 | 0 % | |
1 | 0 % |
고객 리뷰
June 2, 2025
Useful setup helper for traders who care about timing windows. It gives value around session timing, but the value depends on the trader's schedule. I would compare Asia range, London break and New York continuation before trusting it. The tool is most useful when it keeps the trader out of dead hours.
June 1, 2025
June 1, 2025
Decent trade support for session timing. it helps match setups with active market hours, especially when used for planning trades around active sessions. The session view is useful for London and New York, especially when checking the first 60 minutes. The tool is most useful when it keeps the trader out of dead hours.
상담
자주 묻는 질문(FAQ)
Prop
Forex
Indices
Fair Value Gap
SMC
NAS100
트레이딩 봇, 지표, 플러그인 등 cTrader Store에서 제공되는 상품은 제3자 개발자에 의해 제공되며, 이는 단순히 정보 및 기술적 접근을 목적으로 제공된 것입니다. cTrader Store는 중개인이 아니며, 투자 조언, 개인별 추천 또는 향후 성과에 대한 어떠한 보장도 제공하지 않습니다.


가격
가입일 30/05/2025
40
판매