
설명
인덱스 헌터: 개요
인덱스 헌터는 주로 높은 변동성을 가진 지수인 US30 (다우 존스) 및 NAS100 (나스닥)에 특화된 기술 지표이자 의사결정 지원 시스템입니다. 과거 데이터만 보여주는 일반 지표와 달리, 인덱스 헌터는 "벡터 예측"에 중점을 두어 현재 여러 시간대의 속도(기울기)를 기반으로 4개의 캔들 미래 가격 위치를 예측하려고 합니다.
1. 핵심 메커니즘 (작동 원리)
A. "벡터" 예측 엔진
이 도구의 핵심입니다. 단순히 현재 가격만 보는 것이 아니라, M5, M15, H1 시간대 전반에 걸친 변화율(기울기)을 계산하여 차트에 "미래 경로"를 그립니다.
- 메커니즘: 여러 시간대의 모멘텀 가중 평균을 계산하여 미래 4지점(P1, P2, P3, P4)을 예측합니다.
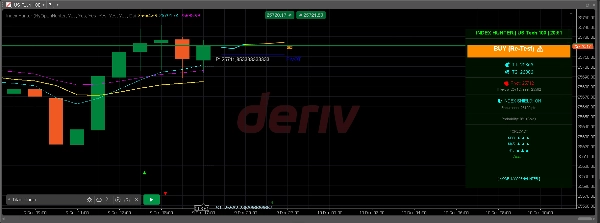
- 시각적 표현: 가격 오른쪽에 시장 관성을 시각화하는 색상 경로(청록색 -> 노란색 -> 주황색)를 표시합니다.
- 고스트 경로: 이전 예측(고스트 경로)을 기억하여 시장이 알고리즘의 과거 예측을 존중하는지("현실 점검") 확인할 수 있습니다.
B. 다중 레이어 시각 시스템
중요한 기관 수준을 자동으로 오버레이합니다:
- 피벗 포인트 (유연함): 선택 가능한 시간대(H12, 일간, Day2, Day3)를 기반으로 피벗, R1/S1, R2/S2 레벨을 자동 계산합니다.
- 심리적 수준: 100포인트 간격(예: 34000, 34100)마다 "심리선"을 그려 지수의 자석 구역 역할을 하는 경우가 많습니다.
- 일일 고가/저가: 전일 범위를 표시하여 돌파 또는 반전 구역을 보여줍니다.
- 프랙탈: 정확한 진입/손절 위치를 위한 지역 고점과 저점을 화살표(▲ ▼)로 식별합니다.
C. "신뢰도" 및 실행 가능성 논리
이 도구는 단순 신호 제공이 아니라 신호를 등급화합니다.
- 계산: 이익 목표까지의 거리와 시장의 현재 에너지(ATR - 평균 진폭 범위)를 비교합니다.
- 출력:
-
- HOT (>80%): 강한 모멘텀 + 합리적인 목표 거리.
- WARM (50-80%): 중간 정도의 설정.
- COLD (<50%): 시장에서는 목표 도달 확률이 낮다고 가정(예: 현재 변동성에 비해 목표가 너무 멀리 있음).
D. 계좌 "방패" 메커니즘
패널에 수동 위험 관리자가 포함되어 있습니다:
- 내구성 지표: 잔액과 최소 로트 크기를 기준으로 계좌가 위험에 처하기 전 시장이 얼마나 많은 "포인트"를 반대 방향으로 움직일 수 있는지 계산합니다.
- 상태: 계좌가 현재 변동성(ATR)에 비해 안전하면 "🛡️ INDEX SHIELD: ON"을 표시하고, 변동성이 잔액에 비해 너무 높으면 "⚠️ LOW MARGIN"을 표시합니다.
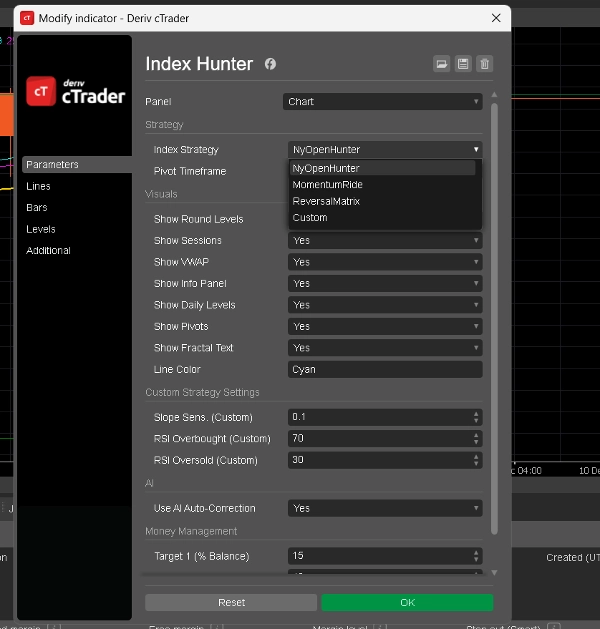
2. 사용 가능한 모드 (전략)
지표 설정에서 이 모드들 간에 전환할 수 있습니다 (
Index Strategy
파라미터). 각 모드는 AI가 시장을 해석하는 방식을 변경합니다.
1. 모드: NyOpenHunter (뉴욕 스캘퍼)
- 적합한 상황: 미국 시장 개장 초기 2-3시간의 혼란스러운 시간대.
- 논리:
-
- 활성 시간: 13:00 - 17:00 UTC (대략).
- 트리거: M5 기울기가 0.1보다 크거나 (또는 -0.1보다 작을 때) 신호를 찾습니다.
- 철학: "폭발을 잡아라." NY 개장 종소리에서 초기 거래량 폭발을 기다리고 그 특정 파동을 타도록 신호를 보냅니다.
- 패널 심리: "NY OPEN BUY 🚀" 또는 "NY OPEN SELL 🔻"을 표시합니다.
2. 모드: MomentumRide (추세 추종자)
- 적합한 상황: 개장 시간 외의 강력하고 지속적인 추세.
- 논리:
-
- 트리거: NY 모드보다 더 강한 M5 기울기(> 0.2)가 필요합니다.
- 철학: "잘려 나가지 마라." 약한 움직임은 무시하고 시장이 강한 확신을 가지고 움직일 때만 신호를 보냅니다.
- 패널 심리: "MOMENTUM UP 🟢" 또는 "MOMENTUM DOWN 🔴"을 표시합니다.
3. 모드: ReversalMatrix (역추세)
- 적합한 상황: 횡보장 또는 고점/저점 포착.
- 논리:
-
- 트리거: RSI(상대 강도 지수)를 사용합니다.
-
- 매도 신호: RSI > 75 (과매수).
- 매수 신호: RSI < 25 (과매도).
- 철학: "극단을 반전시켜라." 고무줄이 너무 늘어났을 때 반동이 올 가능성을 식별합니다.
- 패널 심리: "과매수 (곧 매도)" 또는 "과매도 (곧 매수)"를 표시합니다.
4. 모드: 사용자 정의 (사용자 설정)
- 적합한 상황: 봇을 조정하고자 하는 고급 사용자.
- 논리: 설정에서 기울기 민감도와 RSI 레벨에 대한 임계값을 직접 설정할 수 있습니다.
-
- 예시: 기울기 > 0.05 이고 RSI < 40일 때만 매수하는 하이브리드 전략을 만들 수 있습니다.
3. "정보 패널" (헤드업 디스플레이)
차트 오른쪽의 시각적 패널은 이 모든 데이터를 통합합니다:
- 헤더: 현재 모드와 심볼을 표시합니다.
- 선호도: 주요 AI 편향(예: "BUY 34150 ▲").
- 목표 (T1, T2): 계좌 비율 설정과 변동성을 기반으로 계산된 동적 이익 목표.
- 예측: M30, M45, H1 추세의 순차적 분석(예: "M30: ▲ ▲ ▲"는 강한 매수 정렬을 의미).
- 확률: AI의 신뢰도 점수 (Hot/Warm/Cold).
요약
AI 요약
Index Hunter is a technical indicator designed for momentum analysis on high-volatility US indices, specifically US30 (Dow Jones) and NAS100 (Nasdaq). It projects price movement four candles into the future by calculating a weighted average of momentum (slope) across multiple timeframes (M5, M15, H1), visualizing this as a colored "Future Path" on the chart. The indicator also retains the previous prediction as a "Ghost Path" for comparison.
Key features include an automatic overlay of institutional levels such as pivot points (with selectable timeframes), psychological price levels at 100-point intervals, previous day’s high/low, and fractals marking local tops and bottoms. It incorporates a confidence grading system (Hot, Warm, Cold) based on momentum strength and volatility relative to profit target distance.
Index Hunter includes a risk management "Shield" that assesses account safety by calculating potential adverse market moves against account balance and lot size, displaying status alerts accordingly.
The indicator offers four operational modes: NyOpenHunter (New York market open scalping), MomentumRide (trend following), ReversalMatrix (counter-trend using RSI), and a Custom mode for user-defined slope and RSI thresholds. A comprehensive info panel consolidates mode, bias, dynamic targets, trend forecasts, and confidence scores for decision support.
지표 프로필
고객 리뷰
4.6
리뷰: 3
5 | 67 % | |
4 | 33 % | |
3 | 0 % | |
2 | 0 % | |
1 | 0 % |
고객 리뷰
December 22, 2025
Index Hunter is a solid momentum and trend filter designed with indices in mind. Fast, stable and easy to read, it helps avoid choppy phases and stay aligned with strong moves. Best used as confirmation, especially for intraday index trading.
December 20, 2025
the best part is the trader gets a second pause before entry. Risk rules still need to stay visible.
December 19, 2025
The cleanest use is it helps the plan stay realistic. Overconfidence is the real danger.
상담
자주 묻는 질문(FAQ)
Forex
Signal
Breakout
ZigZag
Scalping
Indices
Supertrend
AI
NAS100
ATR
VWAP
트레이딩 봇, 지표, 플러그인 등 cTrader Store에서 제공되는 상품은 제3자 개발자에 의해 제공되며, 이는 단순히 정보 및 기술적 접근을 목적으로 제공된 것입니다. cTrader Store는 중개인이 아니며, 투자 조언, 개인별 추천 또는 향후 성과에 대한 어떠한 보장도 제공하지 않습니다.


!["[Stellar Strategies] Market Session Ultimate" 로고](https://cdn.ctrader.com/image/webp/61ffd537-0125-4246-9e72-42eca1791d64_28232)


가격
가입일 08/11/2025
23
판매
59
무료 설치