
Volume POC Heatmap
지표
3.33K 다운로드
버전 1.0, Feb 2025
Windows, Mac
5.0
리뷰: 4

설명
Pinescriptlabs 스토어 지표: Pinescriptlabs 스토어 cBots : (cBot) Gold & BTC BreakoutSession Pivots(new)
고급 시장 구조: Bos, Choch, SwinLevels, 주문 블록, 시장 구조 및 유동성 탐색기 (New)
추적 스마트 알고리즘 (new)
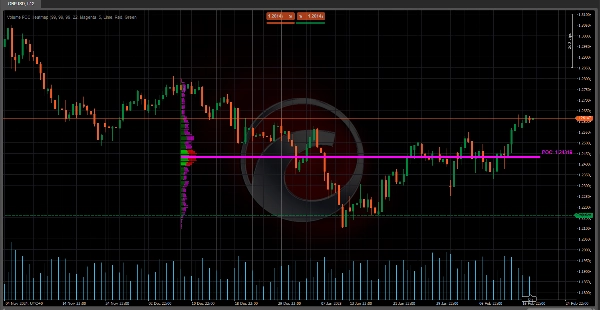
🔥 볼륨 POC 히트맵 🔥
이 지표는 특정 기간 동안 다양한 가격 수준에서 거래된 거래량 분포를 표시하는 볼륨 프로파일입니다. 주요 목적은 주요 지지/저항 구역과 시장이 가장 관심을 보인 영역(높은 매수/매도 활동)을 식별하는 것입니다. 다음에 매우 유용합니다:
- 제어 지점(POC) 감지 🎯
가장 높은 거래량을 가진 가격 수준으로, 가격 움직임의 자석 역할을 합니다. - 가치 영역(VA) 시각화
총 거래량의 특정 비율(예: 70%)이 집중된 구역으로, 매수자와 매도자 간의 균형을 나타냅니다. - 강세 및 약세 거래량 구분 📈📉
매수 세력과 매도 압력이 어디에 축적되는지 보여줍니다.
🧠 핵심 논리 및 계산 🔢
- 가격 범위 분할 📏
-
- 가격 범위(최근 B 바에서 최저가부터 최고가까지)가 볼륨 셀(CNum)로 나뉩니다.
예: CNum = 33 이면, 범위가 33개의 동일 간격 레벨로 분할됩니다.
- 가격 범위(최근 B 바에서 최저가부터 최고가까지)가 볼륨 셀(CNum)로 나뉩니다.
- 레벨별 거래량 분포 📊
-
- 과거 데이터의 각 바에 대해:
-
- 몸통(시가와 종가 차이)과 꼬리(고가와 저가)에 연관된 거래량을 계산합니다.
- 거래량은 바가 교차하는 가격 셀에 비례하여 분배됩니다.
예: 녹색(강세) 바가 3개의 셀을 포함하면, 거래량은 주로 해당 셀들에 "강세 거래량"으로 할당됩니다.
- 제어 지점(POC) 계산 🎯
-
- POC는 가장 누적 거래량이 많은 셀로, 매수자와 매도자 간 가장 많은 합의가 있었던 가격을 나타냅니다.
- 가치 영역(VA) 계산 🔄
-
- POC에서 위/아래로 확장되어 총 거래량의 지정된 % (예: 70%)를 포함합니다.
예: VA가 100에서 105까지라면, 그 범위 내에서 70%의 거래량이 이루어진 것입니다.
- POC에서 위/아래로 확장되어 총 거래량의 지정된 % (예: 70%)를 포함합니다.
- 시각적 정규화 🖼️
-
- 거래량은 스케일 팩터를 사용해 차트의 막대 너비를 조정하여 시각화를 용이하게 합니다.
🛠️ 볼륨 POC 히트맵의 핵심 💡
- 전통적인 거래량 지표의 맥락 부족 🤔
기존 거래량 지표(바별 거래량 등)는 거래된 위치를 보여주지 않습니다. 이 지표는 가격 수준별 거래량을 매핑하여 이 문제를 해결합니다. - 유기적 지지/저항 식별 🚀
높은 거래량 구역은 동적인 지지/저항 역할을 하며, 정적인 선보다 더 신뢰할 수 있습니다. - 불균형 감지 ⚖️
주로 강세 또는 약세 거래량이 많은 영역은 잠재적 돌파 또는 반전을 신호합니다.
💡 거래에서의 실용적 활용 📈
- 관심 구역으로서의 POC 🎯
-
- 가격이 POC에 접근하면 반등이나 횡보 같은 반응을 기대할 수 있습니다.
- 균형 구역으로서의 가치 영역(VA) 🔄
-
- 가격이 VA 밖에 있으면, VA로 되돌아오는 경향이 있습니다(자기장 효과).
- 가격이 VA 안에 있으면, 횡보를 나타낼 수 있습니다.
- 확인 신호로서의 강세/약세 거래량 🔍
-
- 저항에서 강세 거래량 급증은 잠재적 돌파를 시사합니다.
- 지지에서 높은 약세 거래량은 잠재적 붕괴를 나타냅니다.
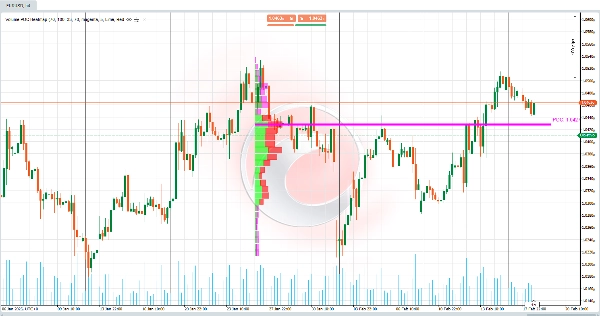
🌟 예시 📊
사용된 매개변수 (사용자가 볼 수 있고 구성 가능):
- Bars Back = 55 → 분석된 과거 바의 수.
- Volume Cells = 33 → 가격 범위 내 분할/셀 수.
- Value Area Volume % = 70 → 가치 영역을 정의하는 거래량 비율.
상황:
- 가격이 기술적 지지선을 돌파하지만, 해당 구역의 거래량은 프로파일에 따르면 낮습니다.
- 이후 가격은 총 거래량의 70%로 정의된 가치 영역(VA)로 되돌아옵니다.
해석:
- 돌파는 거짓이었습니다 (돌파 구역의 낮은 거래량 때문).
- 시장은 더 높은 활동(높은 거래량 밀도)이 있는 가치 영역 내에서 균형을 찾으려 합니다.
행동:
- VA의 하한 또는 POC 근처에서 매수 기회를 찾으세요. 이 구역들은 시장 참여자들에게 높은 관심 구역입니다.
요약
AI 요약
Volume POC Heatmap is a volume profile indicator that visualizes the distribution of traded volume across price levels over a specified historical period. It identifies key market areas such as the Point of Control (POC)—the price level with the highest traded volume—and the Value Area (VA), which encompasses a configurable percentage (e.g., 70%) of total volume, indicating zones of buyer-seller balance. The indicator differentiates bullish and bearish volume by distributing volume proportionally across price cells intersected by each bar, highlighting areas of buying power versus selling pressure.
Key functionalities include:
- Division of the price range into multiple volume cells for detailed volume mapping.
- Calculation of POC as the volume consensus price.
- Determination of the Value Area around the POC.
- Visual normalization of volume bars for clearer chart representation.
This tool addresses the limitation of traditional volume indicators by showing where volume was traded rather than just total volume per bar. It helps identify dynamic support and resistance zones based on volume concentration and detects volume imbalances that may signal potential breakouts or reversals. Traders can use it to anticipate price reactions near the POC and VA, aiding in decision-making for entries and exits. Configurable parameters include the number of historical bars analyzed, volume cells, and the percentage defining the Value Area.
지표 프로필
고객 리뷰
5.0
리뷰: 4
5 | 100 % | |
4 | 0 % | |
3 | 0 % | |
2 | 0 % | |
1 | 0 % |
고객 리뷰
September 7, 2025
Me gusta por la forma en que representa los datos, un poco molesto con el parpadeo, pero es soportable. 😀
July 9, 2025
Pros: Visualizes volume concentration and POC zones as a heatmap. Helps spot high-interest price levels. Stable performance, easy to use. Cons: No tooltips or alerts. Limited customization for transparency and color. Requires other tools for precise trading signals.
June 22, 2025
상담
자주 묻는 질문(FAQ)
BTCUSD
Signal
Breakout
Supertrend
Commodities
RSI
Crypto
XAUUSD
ATR
트레이딩 봇, 지표, 플러그인 등 cTrader Store에서 제공되는 상품은 제3자 개발자에 의해 제공되며, 이는 단순히 정보 및 기술적 접근을 목적으로 제공된 것입니다. cTrader Store는 중개인이 아니며, 투자 조언, 개인별 추천 또는 향후 성과에 대한 어떠한 보장도 제공하지 않습니다.


가격
가입일 03/10/2024
163
판매
37.93K
무료 설치