
Auto-Trend Channel
지표
2.8K 다운로드
버전 1.0, Jan 2025
Windows, Mac
4.4
리뷰: 5
설명
Pinescriptlabs 스토어 지표: Pinescriptlabs 스토어 cBots : (cBot) Gold & BTC BreakoutSession Pivots(new)
고급 시장 구조: Bos, Choch, SwinLevels, 주문 블록, 시장 구조 및 유동성 파인더 (New)
추적 스마트 알고리즘 (new)
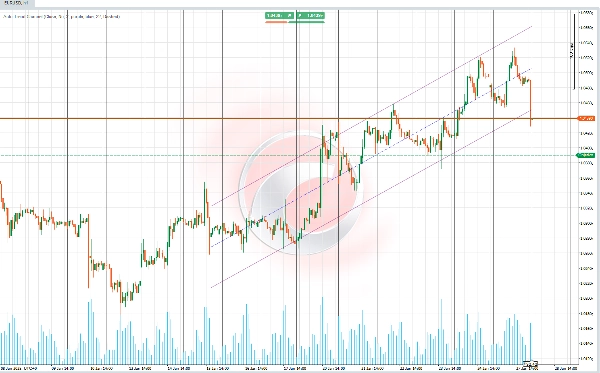
📊 자동-추세 채널 📊
이 지표는 자동으로 선택된 기간 동안 가격 데이터(로그) 의 선형 회귀 및 표준 편차 계산을 기반으로 추세 채널을 그립니다. 📈 기간은 피어슨 상관 계수(RRR)를 사용하여 결정하며, 절대값이 가장 높은 것을 선택합니다. 🧮
✨ 주요 기능 ✨
주요 기능은 고급 통계를 사용하여 지지선, 저항선 및 중앙 추세선을 정의하여 가장 대표적인 기간 길이에 자동으로 적응하는 추세 채널을 계산하는 것입니다.
채널은 다음을 포함합니다:
1️⃣ 계산된 선형 추세를 나타내는 기준선.
2️⃣ 표준 편차에 비례하는 거리에서 채널 밴드를 정의하는 상단 및 하단 선.
🚀 특징 및 계산 🚀
🔎 최적 기간 계산
- 이 지표는 시장 행동과 가장 정확한 상관관계를 가진 기간을 찾기 위해 여러 데이터 기간(구성에 따라 짧거나 김)을 평가합니다.
- 주요 지표로 피어슨 상관계수를 사용하여 과거 가격과 생성된 추세선 간의 가장 강한 관계를 가진 기간을 식별합니다.
📐 선형 회귀 및 가격 투영
- 평가된 각 기간에 대해 극단적인 변동을 안정화하기 위해 가격의 자연 로그를 기반으로 회귀선을 계산합니다.
- 계산의 주요 구성 요소는 다음과 같습니다:
-
- 기울기: 가격 변화율을 나타냅니다.
- 절편: 투영선의 시작점입니다.
- 평균: 기준선을 설정합니다.
📊 표준 편차 및 채널 한계
- 회귀선에 대한 가격의 표준 편차를 계산합니다.
- 사용자가 구성할 수 있는 표준 편차 배수를 사용하여 중앙선을 조정하여 상단 밴드(저항)와 하단 밴드(지지선)를 도출합니다.
🌈 추세 채널 시각화
- 채널은 세 가지 주요 요소로 구성됩니다:
-
- 중앙선: 회귀선을 기반으로 한 주요 추세를 보여줍니다.
- 상단선: 표준 편차로 조정된 채널의 상한선(저항)을 나타냅니다.
- 하단선: 표준 편차로 조정된 채널의 하한선(지지선)을 나타냅니다.
- 사용자는 더 나은 시각적 명확성을 위해 채널의 색상, 투명도 및 선 스타일을 사용자 정의할 수 있습니다.
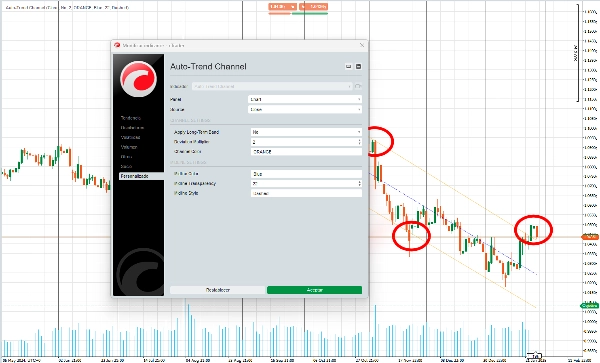
🎛️ 적응성 및 구성
- 사용자는 다음과 같은 지표의 다양한 측면을 개인화할 수 있습니다:
-
- 선과 채널의 색상.
- 장기 추세(매크로 트렌드) 또는 단기 추세(마이크로 트렌드)에 집중할지 여부.
- 이 적응성은 지표가 다양한 거래 스타일과 시각적 선호도에 맞도록 보장합니다.
🔍 사용법 :
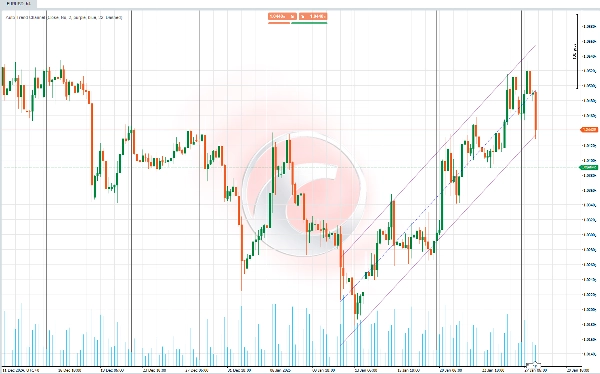
1️⃣ 추세 식별
- 채널의 중앙선은 시장이 상승 추세, 하락 추세 또는 횡보 추세에 있는지 판단하는 데 도움을 줍니다.
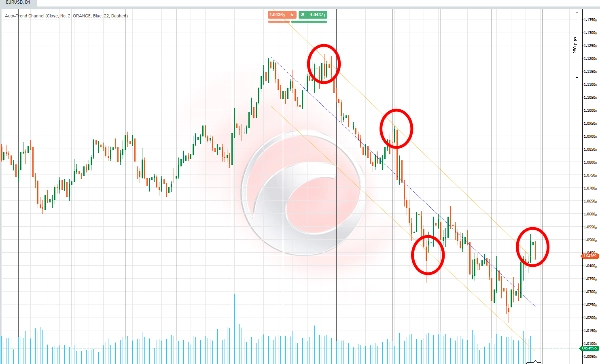
2️⃣ 동적 지지 및 저항
- 상단 및 하단 채널 선은 가격이 반전 또는 통합될 수 있는 잠재적 영역으로 작용합니다.
3️⃣ 통합 및 돌파 감지
- 가격이 채널 내에 머무르면 통합을 나타내며, 돌파는 추세 변화 또는 강한 가격 움직임을 의미합니다.
4️⃣ 다양한 거래 스타일에 대한 조정
- 장기 기간은 일반적인 추세를 식별하고 더 넓은 시간 프레임에서 전략적 결정을 내리는 데 유용합니다.
- 단기 기간은 거래자가 더 빠른 움직임을 포착하고 즉각적인 시장 변화에 대응할 수 있게 합니다.
요약
AI 요약
Auto-Trend Channel is a trading indicator that automatically plots a dynamic trend channel using linear regression and the Pearson correlation coefficient to select the most representative period length. It calculates a baseline linear trend line based on the logarithm of price data, along with upper and lower channel lines set at distances proportional to the standard deviation, representing dynamic resistance and support levels.
Key features include:
- Optimal period selection by evaluating multiple data intervals to find the strongest correlation between historical prices and the trend line.
- Calculation of slope, intercept, and mean for precise linear regression and price projection.
- Visualization of the trend channel with customizable colors, transparency, and line styles.
- Adaptability for different trading styles by allowing focus on long-term (macro) or short-term (micro) trends.
Use cases:
- Identifying market trends (uptrend, downtrend, sideways) via the central trend line.
- Detecting dynamic support and resistance zones where price may reverse or consolidate.
- Recognizing consolidation phases within the channel and breakouts signaling trend changes or strong price movements.
- Adjusting analysis to suit strategic decisions or faster market responses depending on selected period length.
This indicator supports various markets including cryptocurrencies (BTCUSD), commodities (XAUUSD), and others, providing a statistical approach to trend and channel analysis.
지표 프로필
고객 리뷰
4.4
리뷰: 5
5 | 60 % | |
4 | 20 % | |
3 | 20 % | |
2 | 0 % | |
1 | 0 % |
고객 리뷰
October 1, 2025
It works great and definitely helpful to track market behaviour to make more accurate decisions. Thank you!
July 9, 2025
Pros: Automatically detects and draws clear trend channels; adaptive to changing market conditions; easy setup and stable performance. Cons: No alerts on breakout or retest; lacks ability to disable channels per timeframe; can't save custom templates.
May 6, 2025
Thank its amazing. i usually trade trends. 5 star for u, be niicer if u add multitimeframe or periods like 50periods etc.
상담
자주 묻는 질문(FAQ)
BTCUSD
Breakout
Supertrend
Commodities
RSI
Crypto
XAUUSD
ATR
트레이딩 봇, 지표, 플러그인 등 cTrader Store에서 제공되는 상품은 제3자 개발자에 의해 제공되며, 이는 단순히 정보 및 기술적 접근을 목적으로 제공된 것입니다. cTrader Store는 중개인이 아니며, 투자 조언, 개인별 추천 또는 향후 성과에 대한 어떠한 보장도 제공하지 않습니다.


가격
가입일 03/10/2024
163
판매
37.89K
무료 설치