Descrição
Indicadores da loja Pinescriptlabs: cBots da loja Pinescriptlabs : (cBot) Gold & BTC BreakoutSession Pivots(novo)
Projeção de Liquidez de Preço ZigZag
Algoritmo Inteligente de Trailing (novo)
Mapa de Liquidação de Alavancagem
Previsão Baseada em Linreg & ATR
Suporte SmartTrend &
Resistência
Linhas
Sistema de Rompimento de Canal
Análise
Dinâmica da Estrutura
de Mercado
de
Pontos
de Reversão
Regressão
Linear
Fibonacci
Multi-temporal
Gap de Valor Justo de Momentum
Gradiente de Tendência Dinâmico
Rastreador de
Viés de Velas
Multi-Nível
Rastreador de Extremos Zig-Zag
Linha de Tendência
Automática de
Suporte e
Resistência
Linhas
Todos
os níveis de
Suporte e
Resistência
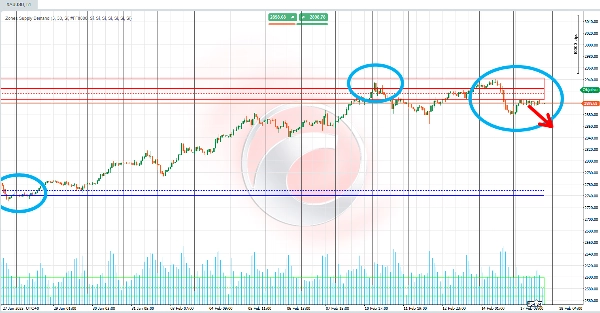
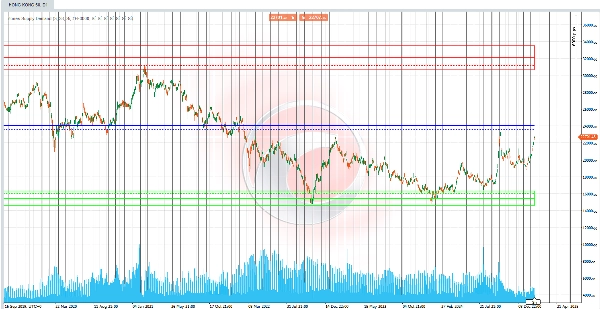
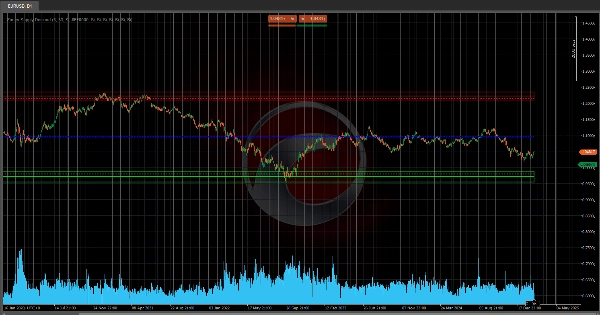
Zonas de Oferta & Demanda
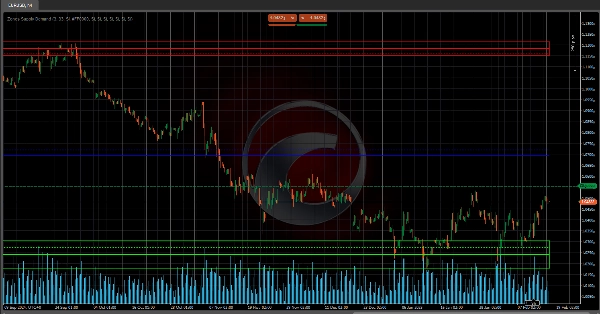
O algoritmo analisa a ação do preço através da acumulação de volume, dividindo o intervalo de preço visível (do máximo ao mínimo) em múltiplos segmentos ou "intervalos." 📏 Para cada intervalo, calcula o volume gerado e o compara a uma percentagem limite predeterminada. O objetivo? Identificar níveis onde a concentração de volume é tão alta que sinaliza uma Zona de Oferta ou Zona de Demanda! 🎯
📉 Para a Zona de Oferta:
- Comece pelo preço mais alto e desça pelos intervalos.
- Acumule o volume em cada segmento.
- Quando o volume acumulado excede o limite, marca uma Zona de Oferta 🚨.
- Uma área colorida (retângulo com opacidade específica) é desenhada deste nível até o topo, junto com linhas horizontais mostrando médias simples e ponderadas dos preços nesta zona. 🖍️
📈 Para a Zona de Demanda:
- Comece pelo preço mais baixo e suba pelos intervalos.
- Acumule o volume em cada segmento.
- Quando o volume acumulado ultrapassa o limite, define uma Zona de Demanda 🚨.
- Uma área correspondente é desenhada, junto com linhas médias para destacar o nível médio de concentração. 🖌️
⚖️ Equilíbrio de Mercado:
Quando ambas as Zonas de Oferta e Demanda são identificadas, o algoritmo calcula um Ponto de Equilíbrio de Mercado! 🌟 Este equilíbrio é derivado da média (simples ou ponderada por volume) entre as duas zonas. O resultado? Linhas de referência claras no gráfico mostrando o equilíbrio entre a pressão de compra e venda! ⚖️✨
✅ Em Resumo:
O indicador "Zonas de Oferta & Demanda" usa segmentação de preço baseada em volume para detectar áreas-chave de concentração de ordens. 🗝️ Em seguida, gera sinais visuais (zonas coloridas, linhas médias e pontos de equilíbrio) para destacar níveis críticos no gráfico, capacitando os traders a identificar desequilíbrios de oferta e demanda e potenciais pontos de reversão! 🚀💡
Resumo
Avaliações de clientes
5 | 0 % | |
4 | 50 % | |
3 | 50 % | |
2 | 0 % | |
1 | 0 % |