


Penerangan
Central Pivot Range (CPR) adalah salah satu alat intrahari yang paling banyak digunakan di kalangan pedagang harian profesional, tetapi kebanyakan penunjuk CPR hanya melukis tiga garis dan berhenti di situ. Central Pivot Range Pro melaksanakan teori CPR sebenar yang digunakan oleh pedagang profesional untuk membaca hari *sebelum* ia berlaku — bukan hanya tahap itu sendiri.
**Apa yang dianalisis:** tinggi, rendah, dan tutup sesi sebelumnya untuk membina Pivot hari ini, Top Central Pivot (TC), dan Bottom Central Pivot (BC), kemudian meletakkan dua bacaan statistik di atasnya yang tidak dimiliki oleh plotter CPR biasa:
- **Peratus Lebar CPR** — lebar CPR hari ini dibandingkan dengan sejarah terkininya. CPR yang sempit (peratus bawah) secara statistik mendahului hari trend dan pecahan; CPR yang lebar (peratus atas) mendahului hari yang terikat julat dan bergelora. Penunjuk ini memberitahu anda yang mana satu yang anda lihat sebelum sesi itu berkembang.
- **Hubungan CPR 2-Hari** — mengklasifikasikan CPR hari ini berbanding CPR semalam menggunakan rangka kerja profesional penuh: **Nilai Lebih Tinggi** (sambungan bullish), **Nilai Lebih Rendah** (sambungan bearish), **Nilai Tidak Berubah** (sambungan trend, volatiliti rendah), **Nilai Dalam** (bergolak, terikat julat), **Nilai Luar** (volatile, risiko pembalikan), atau **Bertindih** (bergerak sisi/tidak pasti). Setiap satu mempunyai implikasi pasaran yang berbeza dan didokumenkan dengan baik.
**Cara membacanya:**
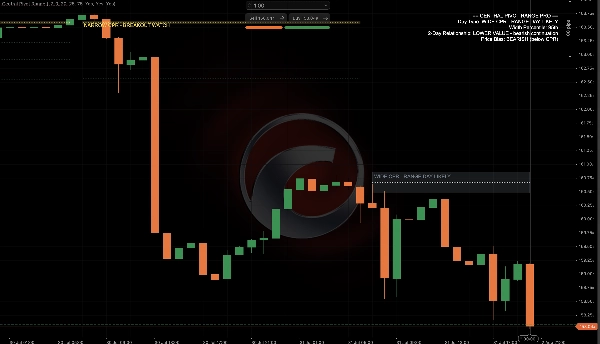
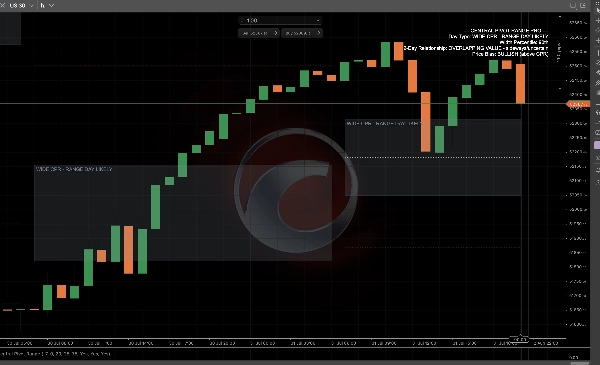
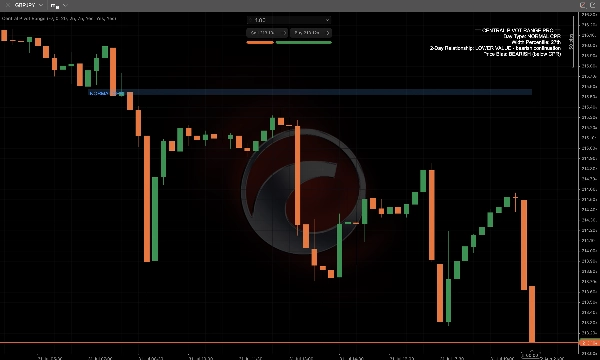
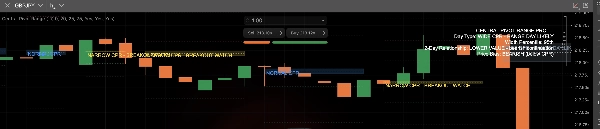
- Kotak CPR yang diarsir diberi warna: **emas** bermaksud CPR sempit (awas pecahan), **kelabu-biru** bermaksud CPR lebar (kemungkinan hari julat), **biru** adalah hari dengan lebar normal.
- Tahap pivot standard S1-S3/R1-R3 dilukis sebagai lapisan rujukan sekunder, boleh dihidupkan atau dimatikan secara bebas.
- Panel HUD langsung memberi anda bacaan dalam bahasa mudah: jenis hari, peratus lebar, hubungan 2 hari, dan sama ada harga sedang berdagang bullish (di atas CPR), bearish (di bawah CPR), atau neutral (dalam CPR).
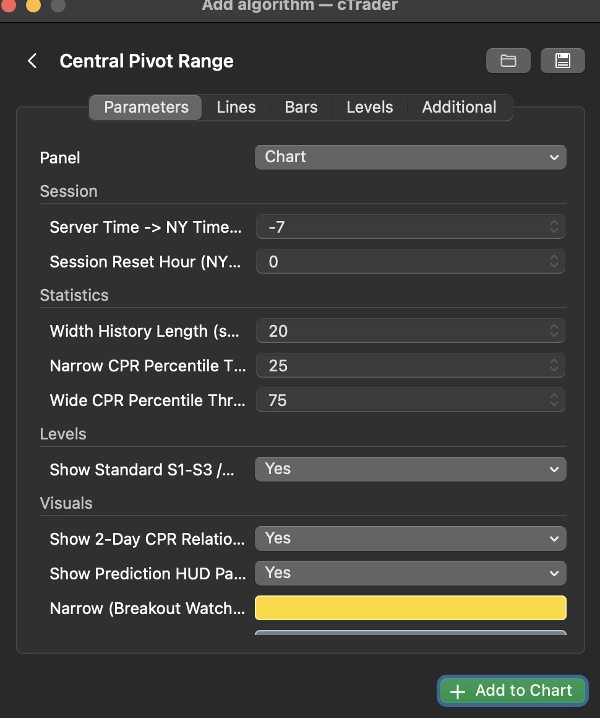
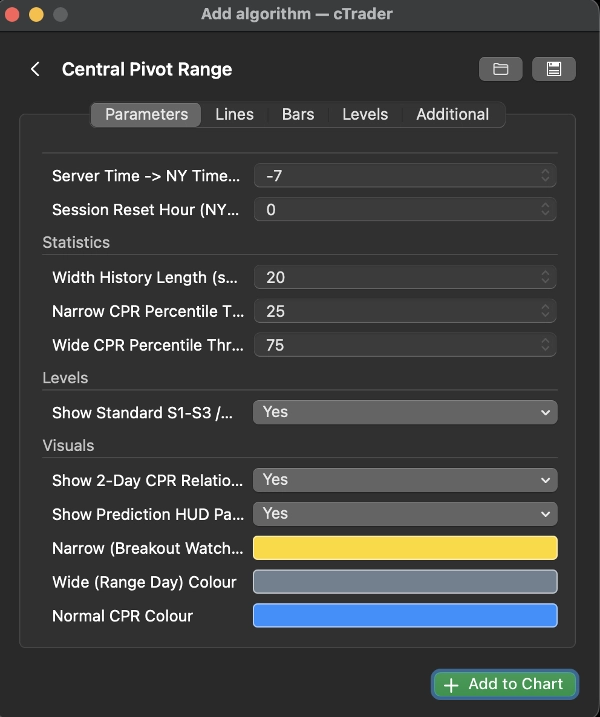
**Tetapan utama:** masa reset sesi (dengan offset masa pelayan ke NY untuk reset harian yang tepat), panjang sejarah lebar dan ambang peratus untuk klasifikasi sempit/lebar, dan togol bebas untuk tahap standard dan tag hubungan.
**Kes penggunaan tipikal:** meramalkan sama ada sesi yang akan datang cenderung untuk trend atau bergelora sebelum ia dibuka; menggunakan hubungan 2 hari untuk menjangka hari sambungan vs. pembalikan; menggabungkan lebar CPR dengan tetapan anda sendiri sebagai penapis volatiliti; menggunakan kedudukan CPR (bullish/bearish/neutral) sebagai pemeriksaan bias sesi.
**Paling sesuai untuk:** pedagang intrahari dan harian pada forex utama, indeks, dan emas yang mahukan bacaan objektif dan berasaskan statistik tentang hari yang akan datang daripada hanya tiga garis rata. Kurang relevan untuk pedagang posisi jangka panjang tulen.
Ringkasan
1. CPR Width Percentile: Ranks the current CPR width against recent history to indicate likely day types—narrow widths suggest potential breakout/trend days, while wide widths indicate range-bound, choppy sessions.
2. 2-Day CPR Relationship: Compares today’s CPR range to yesterday’s, classifying market conditions into categories such as bullish continuation, bearish continuation, trend continuation, choppy, volatile reversal risk, or sideways uncertainty, each with distinct implications.
The indicator visually encodes CPR width with color shading (gold for narrow, grey-blue for wide, blue for normal) and includes standard pivot levels (S1-S3, R1-R3) as optional overlays. A live HUD panel summarizes day type, width percentile, 2-day relationship, and current price position relative to CPR (bullish, bearish, neutral).
Key settings allow customization of session reset timing, width history length, percentile thresholds, and display toggles. This tool is designed for intraday and day traders focusing on forex majors, indices, and gold who seek an objective, statistically grounded forecast of daily market structure and volatility.
Perbincangan
Ulasan pelanggan
Soalan Lazim
Lebih banyak produk daripada penulis ini






























Harga