
FVG_tidypips
Indicator
13 purchases
Version 1.0, Nov 2024
Windows, Mac
4.3
Reviews: 3

Description
This Fair Value Gap (FVG) Indicator is a technical analysis tool that helps traders identify price imbalances.
Features:
- Toggle visibility of bullish and/or bearish gaps
- Displays color-coded boxes for easy visualization (default: green for bullish, red for bearish, gold for midpoint levels)
- Adjustable lookback period to reduce chart clatter
- Configurable box extension setting (offset) for better visualization
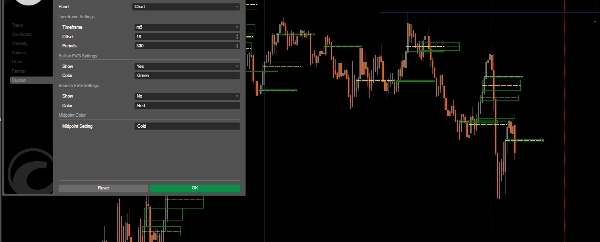
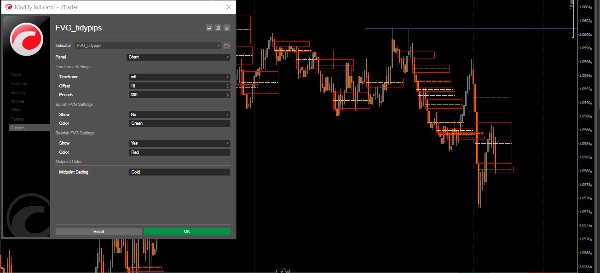
Parameters:
- Timeframe: Select your preferred timeframe to display FVGs
- Offset: Adjust the horizontal extension of FVG boxes (3-500)
- Periods: Set the lookback period for historical FVG calculation
- Show Bullish/Bearish FVGs
- Colours: Customize colours for bullish FVGs, bearish FVGs, and midpoint lines
Trading Applications:
- Support and Resistance: FVGs often act as strong support/resistance levels
- Price Magnets: Unfilled gaps tend to attract price action (DOL)
- Market Structure: Help identify potential reversal zones and continuation points of interest
- Order Block Analysis: Spot institutional trading zones
Best Application Practices:
- Use in conjunction with other technical analysis tools.
- Higher timeframes produce more significant FVGs, Lower timeframes FVG used with Higher timeframe Directional Bias
- Monitor how price reacts when returning to FVG zones
- Pay attention to the midpoint line as it often serves as a price magnet
Check out other useful indicators that I’ve published. If you find this one—or any of my other indicators—helpful, consider supporting my work by purchasing or donating. Your support not only helps me continue developing and improving these tools, but it also ensures I can keep creating new, valuable indicators to enhance your trading experience. Thank you for your continued support!
https://buymeacoffee.com/tidypips
Summary
AI summary
The FVG_tidypips indicator is a technical analysis tool designed to identify Fair Value Gaps (FVGs), which represent price imbalances on trading charts. It visually highlights bullish and bearish gaps using color-coded boxes—green for bullish, red for bearish, and gold for midpoint levels—facilitating quick recognition of potential support and resistance zones. Users can toggle the visibility of bullish and/or bearish gaps, adjust the lookback period to manage chart clutter, and configure the horizontal extension (offset) of the FVG boxes for clearer visualization.
Key parameters include selecting the timeframe for FVG display, setting the offset range (3–500), defining the lookback period for historical gap calculation, and customizing colors for different gap types and midpoint lines. The indicator supports trading applications such as identifying strong support/resistance levels, spotting price magnets where unfilled gaps attract price action, analyzing market structure for potential reversal or continuation zones, and detecting institutional order block areas.
Best practices recommend using this indicator alongside other technical tools, focusing on higher timeframes for more significant FVGs, and monitoring price reactions when revisiting FVG zones. The midpoint line is noted as an important price magnet. This tool is applicable across various markets, including commodities like gold (XAUUSD).
Indicator profile
Customer reviews
4.3
Reviews: 3
5 | 33 % | |
4 | 67 % | |
3 | 0 % | |
2 | 0 % | |
1 | 0 % |
Customer reviews
November 22, 2024
Good idea with limits for traders who use ICT or SMC concepts. It gives value around smart money style analysis, but zones still need manual validation. A good sample is 20 FVG or order block reactions, with messy 0.705 areas skipped. The zone is more convincing when structure and risk both make sense.
November 21, 2024
November 21, 2024
Small but practical edge for smart money style analysis. it adds structure around liquidity, gaps and market shifts, especially when used for mapping zones before entries. For SMC logic, I trust zones more when 0.5 mitigation, BOS and liquidity sweep line up. The zone is more convincing when structure and risk both make sense.
Discussion
FAQ
Commodities
XAUUSD
Products available through cTrader Store, including trading bots, indicators and plugins, are provided by third-party developers and made available for informational and technical access purposes only. cTrader Store is not a broker and does not provide investment advice, personal recommendations or any guarantee of future performance.
More from this author


Price
15
Sales
4.63K
Free installs