Brokers & props
For business
00
Days
:
00
Hours
:
00
Minutes
:
00
Seconds
Moving Average channel
"Moving Average channel" logo
Since 19/11/2024
Sales
15
Free installs
3356
"Moving Average channel" uploaded image"Moving Average channel" uploaded image

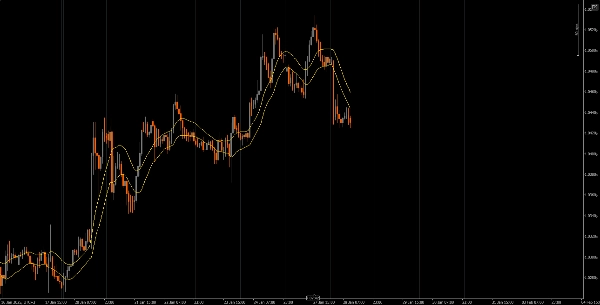
Customizable moving averages (MAs) on a chart, using different types of MAs (Simple, Weighted, Exponential) and price data sources (Close, Open, High, Low)
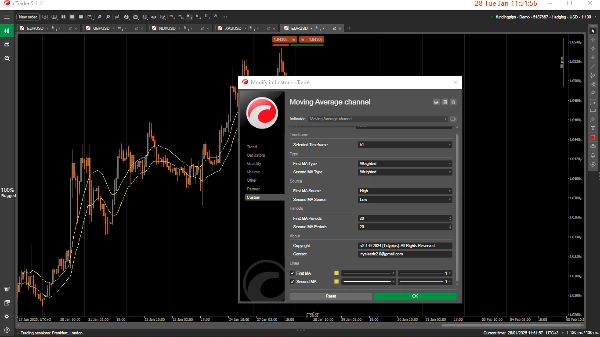
The WMA and SMA Indicator provides flexibility in visualizing moving averages based on user-defined parameters. It supports three types of moving averages: Simple (SMA), Weighted (WMA), and Exponential (EMA). The user can apply these averages to various data sources like Close, Open, High, Low, or calculated values such as Median, Typical, and Weighted Prices.

This tool also lets you select the timeframe for which the indicator is active, ensuring you focus on specific data periods without cluttering your charts with unnecessary information.

Check out other useful indicators that I’ve published. If you find this one—or any of my other indicators—helpful, consider supporting my work by purchasing or donating. Your support not only helps me continue developing and improving these tools, but it also ensures I can keep creating new, valuable indicators to enhance your trading experience. Thank you for your continued support!


https://buymeacoffee.com/tidypips

0.0
Reviews: 0
Customer reviews
No reviews for this product yet. Already tried it? Be the first to tell others!
More from this author
ICT Killzone and Sessions high_low
This indicator is an essential tool for traders seeking to visualize key trading sessions on their charts.
Indicator
XAUUSD
Commodities
FVG_tidypips
A Fair Value Gap (FVG) indicator that identifies potential price imbalances, potential reversal and continuation zones
Previous Day Liquidity Zones (PDH - PDL)
Useful indicator for traders who want to visualize key price levels based on previous daily highs and lows.
Daily Open Pivot Level
This indicator is a valuable tool for traders looking to identify significant opening price level of any asset.
Drawing Utility
A rectangular box with 5 adjustable Fibonacci level or even custom ones.
Indicator
XAUUSD
Commodities
True Open Pivot Levels
This indicatorFull Description: Th shows the open price lines at key market times based on Eastern Standard Time (EST).
Previous Day Equilibrium (Premium & Discount)
Plots the equilibrium price levels based on previous daily highs and lows.
You may also like
Indicator
RSI
Breakout
Supertrend
Swing Levels
🔍 Automatically detect support and resistance levels based on "swings" or pivots
Indicator
Stocks
Forex
Crypto
PinBarCandlestickPattern
PinBarCandlestickPattern Indicator
Indicator
Grid
NAS100
XAUUSD
+6
AutoFibRetracement
A powerful overlay tool designed to automatically plot Fibonacci retracement levels based on a custom window.
MM-Symbol Info (free)
Enhance the trading experience with real-time Spread, Time To Close, rPNL, uPNL, PNL and minimalistic Bid / Ask lines
Indicator
Indices
Stocks
Commodities
+2
EMAScalpHistogram
EMAScalpHistogram
Indicator
NAS100
NZDUSD
XAUUSD
+12
rvwap v1
Rolling VWAP with dynamic or fixed time window, customizable source price and standard deviation bands.
Indicator
Breakout
Higher Timeframe Candlestick
Overlay a real-time higher-timeframe candle on your chart — color-coded bias without switching TFs.
Indicator
Stocks
Forex
MACD
+1
SmartBot-Volume MACD
a revolutionary indicator that integrates volume into MACD.
DMI 3 bar v2
Shows BUY & SELL signals for 3 & 4 BAR PATTERN (Morning star/ Evening star). It is adjustable and it will SHOW ARROWS.
Indicator
Indices
RSI
Breakout
+6
ZigZagColor
The ZigZag indicator is a technical analysis tool primarily used to identify key price reversal points.
Indicator
Bollinger
E7 Indicators Free Studies
ADXR, KDJ, SineWave, Bollinger Band Volatility and AEOscillator.
Indicator
Indices
Stocks
Commodities
+2
Deviation-Scaled Moving Average
Momentum-adaptive MA: scales responsiveness via deviation — fast in trend, smooth in chop.
Indicator
NAS100
RSI
NZDUSD
+14
VWARSI_noSourceCode
The Volume-Weighted Edge: Improved RSI that can actually read the market moves.
Indicator
RSI
Breakout
Signal
+1
ZScore
Z-Score measures price deviation from its average, helping identify extremes, trends, and trading opportunities ........
Indicator
NAS100
XAUUSD
Prop
+5
Support and Resistance MTF Pro
🟢 Strength-ranked S/R zones with MTF levels and Pro labels. Nearest-zone band and HUD for faster, cleaner entries. 🔴
Donchian Flux Cloud
Trend-coloring Donchian cloud that highlights volatility squeezes and breakouts.
Indicator
RSI
Indices
Signal
QQE-MTF
Multi-timeframe version of the Quantitative Qualitative Estimation (QQE) indicator.