Description
It allows users to mark the opening and closing times of major trading sessions—Asian, London, New York, and London Close—with customizable colors, styles, and thicknesses. This indicator draws high and low trendlines for each session, providing insights into market behavior. With user-friendly drag-and-drop(+Alt Key) functionality it makes plotting sessions highand low quick. Perfect for both novice and experienced traders, this indicator makes it easier to navigate the complexities of different market sessions.
Features
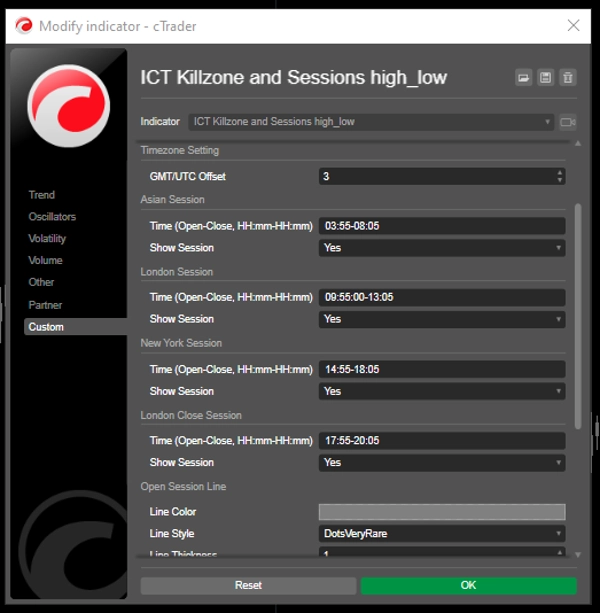
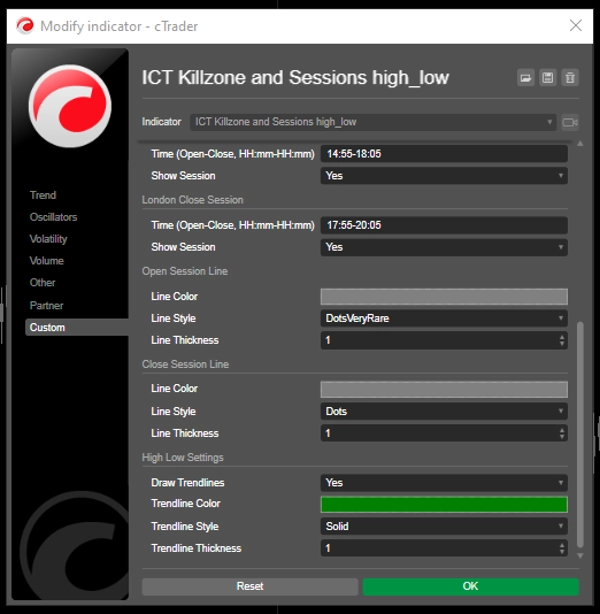
Customizable Session Times: Users can define the opening and closing times for major trading sessions (Asian, London, New York, and London Close), allowing for tailored visualization that fits their trading strategies.
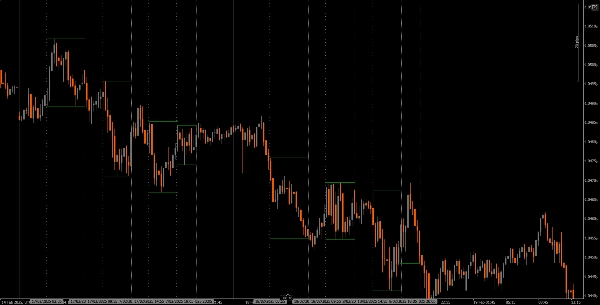
Dynamic Vertical Lines: The indicator draws vertical lines at session open and close times, making it easy to identify key market events at a glance.
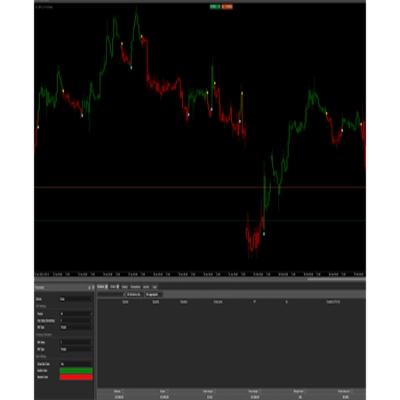
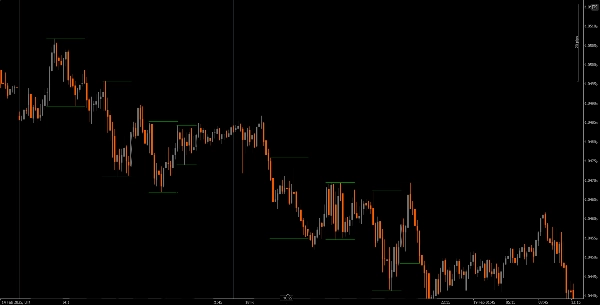
Trendline Visualization: It can automatically draw high and low trendlines for each session, allowing traders to see potential support and resistance levels based on session price action.
User-Friendly Drag-and-Drop(+Alt Key): The drag-and-drop(+Alt Key) functionality enables traders to easily select specific time ranges to analyze, enhancing the overall user experience.
Session Labels: The option to display labels next to session trendlines adds clarity, helping traders quickly identify which session they are analyzing.
Timezone Adjustment: Users can set a GMT/UTC offset, ensuring that session times are accurately represented according to their local time zone.
Tutorial
Installation: Download and install the The ICT Killzone and Sessions high_low indicator on your cAlgo platform.
Setup: Open the settings to customize your session times, colors, line styles, and thickness according to your preferences.
Using the Indicator: Click and drag (+ Alt Key)on the chart to create a rectangle that encompasses the time range you want to analyze. The indicator will automatically draw vertical lines and trendlines for the specified sessions.
Analyze: Observe the session lines and trendlines as you trade. Use this information to identify potential support and resistance levels based on session dynamics.
Recommended Companion Tools
cTrader: The native platform for cAlgo, providing a seamless experience for using and customizing indicators.
Market Analysis Tools: Combine this indicator with market analysis tools, such as moving averages or oscillators, to enhance your trading strategy.
Risk Management Tools: Use position size calculators and stop-loss tools to effectively manage risk while trading.
By integrating the The ICT Killzone and Sessions high_low indicator with these tools, traders can improve their market analysis and increase their chances of success in navigating the complexities of different trading sessions.
Summary
A drag-and-drop (+Alt Key) feature allows quick selection of specific time ranges for analysis. Optional session labels clarify which session is being viewed. Timezone adjustments via GMT/UTC offset ensure session times align with the trader’s local time zone.
Designed for use on the cAlgo platform, this tool supports enhanced market analysis when combined with other market analysis and risk management tools. It assists traders in navigating the complexities of different market sessions by providing clear visual cues and trendline insights.
Customer reviews
5 | 40 % | |
4 | 20 % | |
3 | 0 % | |
2 | 0 % | |
1 | 40 % |