"Drawing Utility" logo
Drawing Utility
0.0
24/07/2025
33
Desktop

Alt + Drag to activate it on your charts.

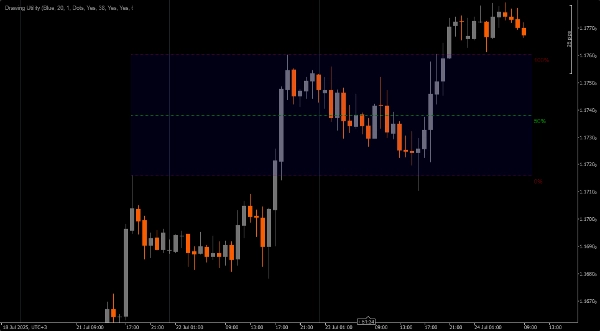
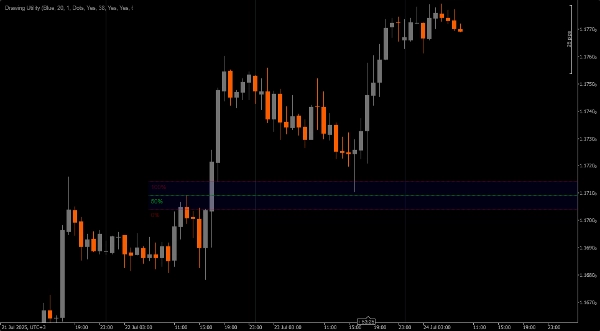
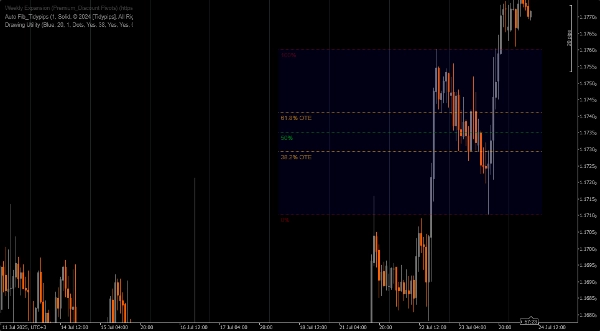
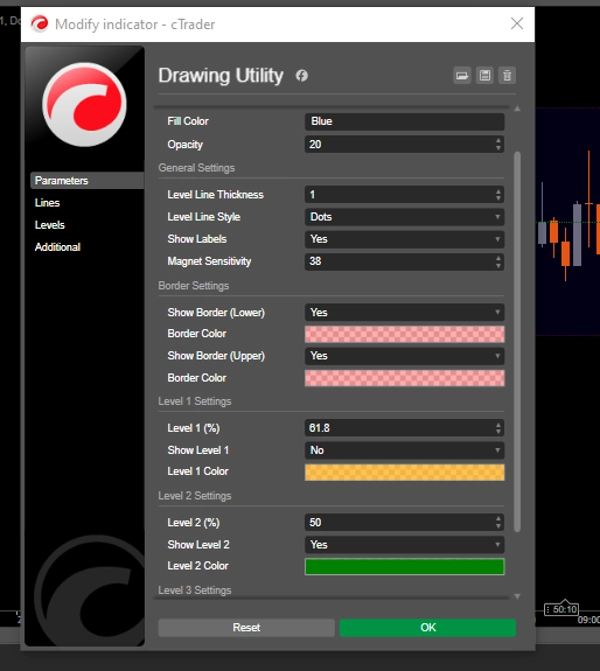
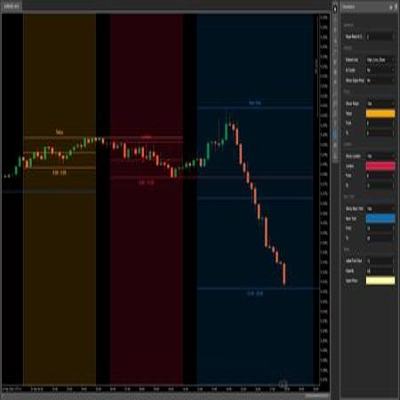
Customizable drawing utility.

1. Quick access Fibonacci.
2. Fair Value Gap marker
3. Measuring tool
4. Point Of Interest marker
5. or any other use (I have not thought of) you may find fitting to annotate your charts

NOTE **Alt + Drag to activate it on your charts.**

More from this author
ICT Killzone and Sessions high_low
This indicator is an essential tool for traders seeking to visualize key trading sessions on their charts.
Indicator
xauusd
commodities
FVG_tidypips
A Fair Value Gap (FVG) indicator that identifies potential price imbalances, potential reversal and continuation zones
Previous Day Liquidity Zones (PDH - PDL)
Useful indicator for traders who want to visualize key price levels based on previous daily highs and lows.
Daily Open Pivot Level
This indicator is a valuable tool for traders looking to identify significant opening price level of any asset.
Moving Average channel
This indicator is designed to display customizable moving averages (MAs) on a chart.
Indicator
commodities
xauusd
True Open Pivot Levels
This indicatorFull Description: Th shows the open price lines at key market times based on Eastern Standard Time (EST).
Previous Day Equilibrium (Premium & Discount)
Plots the equilibrium price levels based on previous daily highs and lows.
You may also like
Indicator
forex
breakout
btcusd
+7
Anchored VWAP by LudwigICT
Anchored VWAP (Auto hi-lo) by LudwigICT
True Deviation System
True Deviation System – Precision Meets Professional Trading
Parabolic SAR Alert
Parabolic SAR Alert - Trend reversal alerts with smart signals & custom alerts.
RSI Divergence Pro
This an RSI Divergence indicator which fulfill seller's need.
Indicator
forex
crypto
signal
+1
Engulfing Pattern Indicator
Indicator
forex
indices
rsi
+3
Advanced RSI Indicator
Advanced RSI Indicator with multi-MA smoothing, Bollinger Bands, divergence detection, and fill zones for cTrader.
Indicator
forex
bollinger
indices
+1
[Stellar Strategies] Market Regime Filter
Filters market regimes (trend/range/pullback) using MAs, ADX, ATR/BBW Vol, opt. Volume. Helps adapt strategy. 📉📈
RangeBoxLevel
This technical analysis indicator provides information on market sentiment, trend and price levels....
"STC" logo
5.0
(2)
STC
Schaff Trend Cycle (STC) Indicator
Candelstick xxl
The indicator is designed to detect aggressive movements in the market and without volume for trend changes.
Vishal Volume Profile v2.0
Volume Profile plots traded volume at each price level, highlighting high activity zones of precise support & resistance
Daily SD Levels - Indicator
Plots intraday VWAP and dynamic ±1/±2 standard deviation (SD) bands based on current day’s price and volume.
SessionPowerZonesPro
Highlights market sessions & overlaps with real-time range & volume stats – perfect for pro scalpers.
Ten Thousand Functions Bands Cloud(First Edition)
A metric that can set 1 to 3 groups of Bollinger Bands
Indicator
prop
atr
ADT_bigCandles
Outside Candle Detector: Highlights major candles/zones with ATR filter & pattern labels. By Avydel Talbo, prop trader.
Indicator
bollinger
Repiptor BB Width
Bollinger Bands Width
Indicator
indices
commodities
CCI - With Arrows and 40 80 EMA Logic_noSourceCode
The Advanced CCI & EMA Indicator combines the CCI with 40 & 80 EMA logic to generate precise arrows signaling direction
Indicator
breakout
rsi
macd
ZigZagColor
The ZigZag indicator is a technical analysis tool primarily used to identify key price reversal points.