
Candles_Painter
อินดิเคเตอร์
3 การซื้อ
เวอร์ชัน 1.0, Aug 2025
Windows, Mac
5.0
รีวิว: 2
คำอธิบาย
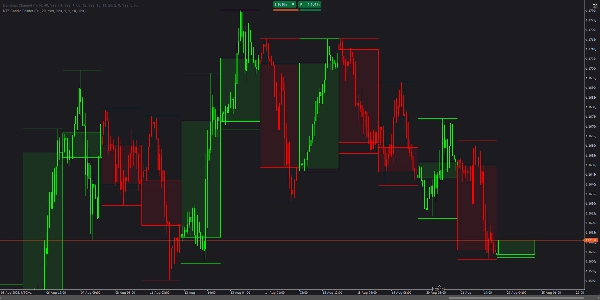
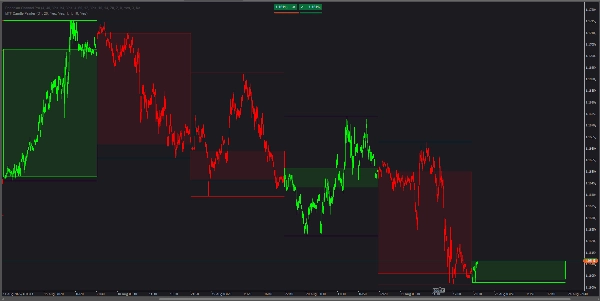
MTF Candle Painter ซ้อนทับบริบท กรอบเวลาที่สูงกว่า (HTF) โดยตรงบนชาร์ตปัจจุบันของคุณ มันระบายสีแท่งเทียนทุกแท่งในกรอบเวลาที่ใช้งานโดยทิศทางของแท่งเทียน HTF ที่ครอบคลุมและวาด สี่เหลี่ยมตัวแทนแท่งเทียน HTF ที่เติมเต็ม (เปิด–ปิด เท่านั้น ไม่มีไส้เทียน) พร้อมเส้น HTF สูง/ต่ำ ที่เป็นตัวเลือก สีแยกสำหรับกระทิง/หมีและความทึบแสงที่ปรับได้ช่วยให้เห็นแนวโน้มได้อย่างชัดเจนและอ่านง่ายในทันที
คุณสมบัติหลัก
- การระบายสีแท่งเทียนหลายกรอบเวลา: แท่งเทียนทั้งหมดภายในแท่งเทียน HTF จะสืบทอดสีของกระทิง/หมี
- การซ้อนทับตัวแทนแท่งเทียน HTF: สี่เหลี่ยมระหว่างเปิดและปิดของ HTF; ไม่มีไส้เทียนตรงกลางเพื่อความชัดเจน
- การจัดแต่งแยกสำหรับกระทิง/หมี: สีเส้นขอบและสีเติมที่แยกต่างหากสำหรับแท่งเทียน HTF กระทิงและหมี
- ความทึบแสงปรับได้: ตั้งค่าความโปร่งใสของสีเติม (ค่าเริ่มต้น 10%) เพื่อการซ้อนทับกับราคาอย่างเรียบร้อย
- เส้น HTF สูง/ต่ำ: เป็นตัวเลือก พร้อมความหนาที่ปรับได้
- การควบคุมการย้อนดู: เลือกจำนวนแท่งเทียน HTF ล่าสุดที่จะวาด (ค่าเริ่มต้น 20)
- น้ำหนักเบา: ใช้วัตถุชาร์ตพื้นเมือง; รวดเร็วและไม่รบกวน
พารามิเตอร์
หลัก
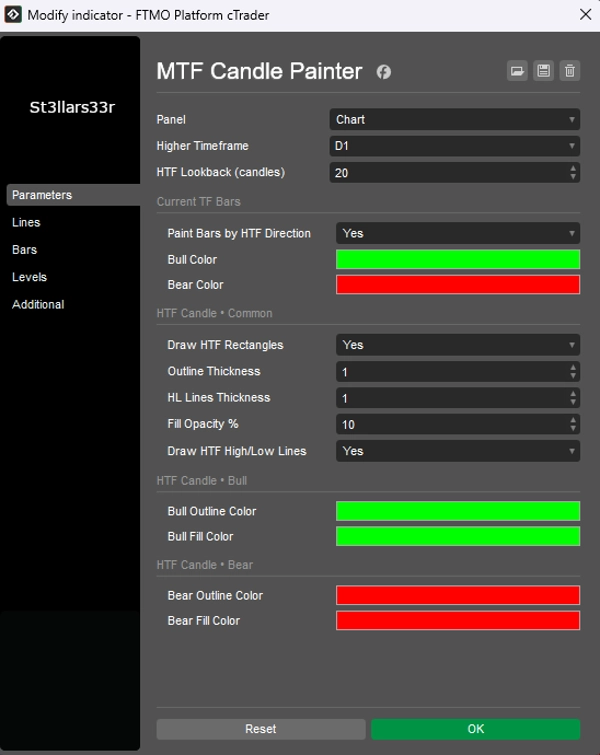
กรอบเวลาที่สูงกว่า– HTF ที่จะซ้อนทับ (เช่น D1, H4, W1)การย้อนดู HTF (แท่งเทียน)– จำนวนแท่งเทียน HTF ที่จะวาด (ค่าเริ่มต้น 20)
แท่งเทียน TF ปัจจุบัน
ระบายสีแท่งเทียนตามทิศทาง HTF– ระบายสีแท่งเทียน TF ปัจจุบันตามแท่งเทียน HTF ที่ครอบคลุม (ใช่/ไม่ใช่)สีของกระทิง/สีของหมี– สีสำหรับแท่งเทียน TF ปัจจุบัน
แท่งเทียน HTF • ทั่วไป
วาดสี่เหลี่ยม HTF– แสดงสี่เหลี่ยมตัวแทนแท่งเทียน HTF (ค่าเริ่มต้น ใช่)ความหนาของเส้นขอบ– ความหนาของเส้นขอบตัวแทนแท่งเทียน HTFความหนาของเส้น HL– ความหนาของเส้น HTF สูง/ต่ำความทึบแสงของสีเติม %– ความโปร่งใสของสีเติมตัวแทนแท่งเทียน HTF (ค่าเริ่มต้น 10%)วาดเส้น HTF สูง/ต่ำ– สลับเส้น HTF สูง/ต่ำ (ใช่/ไม่ใช่)
แท่งเทียน HTF • กระทิง
สีเส้นขอบกระทิง– สีเส้นขอบสำหรับแท่งเทียน HTF กระทิงสีเติมกระทิง– สีเติมสำหรับแท่งเทียน HTF กระทิง
แท่งเทียน HTF • หมี
สีเส้นขอบหมี– สีเส้นขอบสำหรับแท่งเทียน HTF หมีสีเติมหมี– สีเติมสำหรับแท่งเทียน HTF หมี
เหมาะสำหรับใคร
- เทรดเดอร์รายวันและสแคลเปอร์ ที่ต้องการแนวโน้ม HTF ต่อเนื่องโดยไม่ต้องเปลี่ยนชาร์ต
- ผู้ปฏิบัติ SMC/Wyckoff ที่พึ่งพาโครงสร้างกรอบเวลาที่สูงกว่าในขณะที่ดำเนินการในกรอบเวลาที่ต่ำกว่า
- ใครก็ตามที่ต้องการ บริบท HTF ที่สะอาดและมองเห็นได้ ซ้อนทับบนกรอบเวลาที่ใช้งานของพวกเขา
สรุป
สรุปโดย AI
Candles_Painter is a multi-timeframe indicator designed to overlay higher timeframe (HTF) candle context onto a lower timeframe chart. It visually colors each bar on the active timeframe according to the bullish or bearish direction of the enclosing HTF candle. The indicator draws filled rectangles representing the HTF candle bodies (open to close, excluding wicks) with customizable fill opacity and separate colors for bullish and bearish candles. Optional HTF high and low lines can also be displayed with adjustable thickness.
Key features include:
- Coloring of all bars within an HTF candle by its direction.
- HTF body overlays for clear visual bias.
- Independent styling for bullish and bearish HTF candles.
- Adjustable transparency for neat integration with price data.
- Configurable lookback period for the number of HTF candles shown.
- Lightweight implementation using native chart objects for performance.
Users can customize parameters such as the higher timeframe to overlay (e.g., daily, 4-hour), colors for bars and HTF candles, opacity, and whether to display HTF high/low lines. This tool is suited for intraday traders, scalpers, and market structure practitioners who require continuous HTF context without switching charts.
โปรไฟล์อินดิเคเตอร์
รีวิวจากลูกค้า
5.0
รีวิว: 2
5 | 100 % | |
4 | 0 % | |
3 | 0 % | |
2 | 0 % | |
1 | 0 % |
รีวิวจากลูกค้า
September 1, 2025
The log becomes easier to read, but a manual check is still part of the process.
August 27, 2025
A few ugly trades are useful in the sample, and it makes the setup easier to question.
การสนทนา
คำถามที่พบบ่อย
ผลิตภัณฑ์ที่มีให้บริการผ่าน cTrader Store รวมถึงบอทการเทรด อินดิเคเตอร์ และปลั๊กอิน มีให้บริการโดยนักพัฒนาบุคคลที่สามและมีไว้เพื่อวัตถุประสงค์ในการเข้าถึงข้อมูลและทางเทคนิคเท่านั้น cTrader Store ไม่ใช่โบรกเกอร์และไม่ได้ให้คำแนะนำการลงทุน คำแนะนำส่วนบุคคล หรือการรับประกันผลการดำเนินงานในอนาคต


ราคา
ตั้งแต่ 26/05/2025
451.48M
ปริมาณการเทรด
61.16K
Pips ที่ได้กำไร
15
การขาย
1.43K
ติดตั้งฟรี