
Series - FXMaster
Gösterge
3 satın almalar
Sürüm 1.0, Jul 2025
Windows, Mac
4.6
Değerlendirmeler: 3

Açıklama
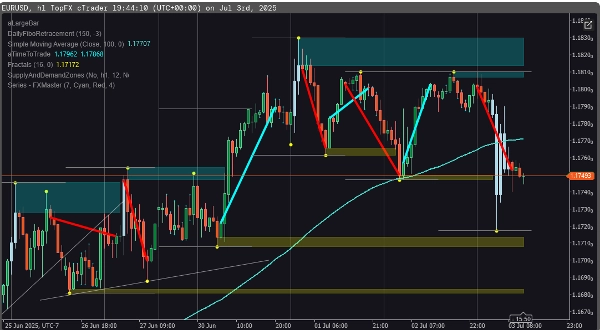
Yüksek olasılıklı trendleri hassasiyetle ortaya çıkarın. Multi-Symbol Trendlines göstergesi, Yüksek Yüksekler / Yüksek Düşükler / Yüksek Kapanışlar veya Düşük Düşükler / Düşük Yüksekler / Düşük Kapanışlar serilerini tespit eder, size net, özelleştirilebilir içgörüler sunar—herhangi bir piyasa sembolünde yükseliş ve düşüş trendleri hakkında.
🚀 Temel Özellikler
- Trend Dizisi Tespiti: Ardışık fiyat yapılarına dayalı yükseliş veya düşüş dizilerini tespit edin.
- Özelleştirilebilir Eşikler: Geçerli bir trendi onaylamak için kaç bar gerektiğini ayarlayın—stratejinize uyacak şekilde ayarlayın.
- Görsel Trend Çizgileri: Trend çizgilerini doğrudan grafiğinizde otomatik olarak çizer—yükseliş ve düşüş trendleri için renk kodlu.
🎯 Kimler İçin
- Fiyat Hareketi Tüccarları göstergelerden çok yapı ve ritme güvenenler.
- Trend Takipçileri erken yapı onayı arayanlar.
- Çoklu Sembol İzleyicileri hepsini yönetmek için tek bir araca ihtiyaç duyanlar.
Özet
YZ özeti
The Series - FXMaster indicator identifies high-probability trends by detecting sequences of price action patterns such as Higher Highs, Higher Lows, High Closes, Lower Lows, Lower Highs, and Low Closes. It provides clear, customizable insights into uptrends and downtrends across any market symbol, including Forex, indices, commodities, cryptocurrencies, and stocks. Key features include trend sequence detection to spot bullish or bearish patterns based on consecutive price structures, customizable thresholds allowing users to set the number of bars required to confirm a trend, and automatic drawing of color-coded trendlines directly on charts for visual clarity. This tool is designed for price action traders who prioritize market structure and rhythm, trend followers seeking early confirmation of trends, and multi-symbol watchers who require a unified indicator for multiple markets.
Gösterge profili
Müşteri değerlendirmeleri
4.6
Değerlendirmeler: 3
5 | 67 % | |
4 | 33 % | |
3 | 0 % | |
2 | 0 % | |
1 | 0 % |
Müşteri değerlendirmeleri
July 14, 2025
The opening read should not drive the whole decision, but it is just a support layer.
July 8, 2025
The journal has a cleaner path, but it works better with a written plan.
Tartışma
SSS
Forex
Indices
Commodities
Crypto
Stocks
cTrader Store üzerinden erişilebilen işlem botları, göstergeler ve eklentiler gibi ürünler, üçüncü taraf sağlayıcılar tarafından sağlanır ve yalnızca bilgilendirme ve teknik erişim amaçlarıyla sunulur. cTrader Store bir broker değildir ve yatırım tavsiyesi, kişisel öneriler vermez veya gelecekteki performansı garanti etmez.


Fiyat
Başlangıç 11/01/2025
19
Satışlar