
Açıklama
🧭 İşlemlerinizi saate göre zamanlayın: Atlas, piyasaların ay, hafta günü ve saate göre ne zaman hareket etme eğiliminde olduğunu gösterir. 🧭
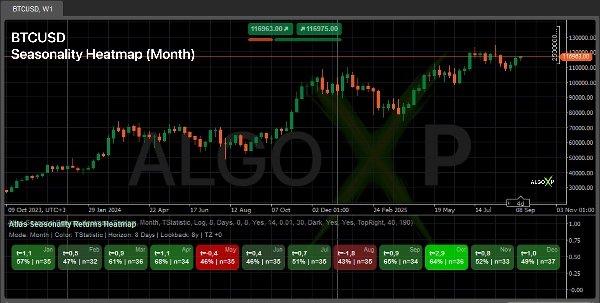
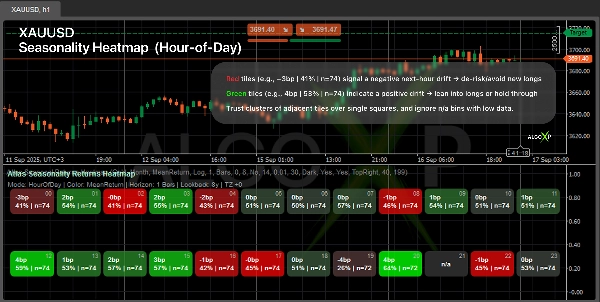
Pazarınızın ne zaman hareket etme eğiliminde olduğunu görün — Ay, Hafta Günü veya Günün Saati bazında.
Atlas, seçtiğiniz bir zaman dilimi için ileri getirileri hesaplar ve simetrik bir ısı haritası (Aşağı → Sıfır → Yukarı) çizer. Her kutucuk bir metriği gösterir (Ortalama, T-istatistiği veya Sharpe) ve ayrıca başarı% | n içerir. Bunu giriş/çıkış zamanlaması yapmak, seansları planlamak ve riski filtrelemek için kullanın.
🎯 Tüccarların neden kullandığı
- Yeşil pencereleri görün ve pozisyona girin, kırmızı pencerelerde ise bekleyin.
- Seansları istatistiksel olarak avantajlı saatler/günler etrafında planlayın.
- Discretionary ve sistematik stratejilere temiz bir “ne zaman” katmanı ekleyin.
⚙️ Nasıl çalışır
- Seçtiğiniz bir zaman penceresine bakar ve fiyatın bu pencerede nasıl hareket etme eğiliminde olduğunu özetler.
- Sonuçları zaman dilimlerine (Ay / Hafta Günü / Saat) göre gruplar ve zaman diliminize saygı gösterir.
- Her dilim için aykırı değer koruması ve güçlü bir skor uygular (artı örneklem büyüklüğü).
- Nötr etrafında dengeli bir ısı haritası çizer ve Yukarı / Sıfır / Aşağı renklerinizi kullanır.
👥 Kimler için
- Discretionary tüccarlar — seans bazında daha iyi zamanlama ve pozisyon büyüklüğü.
- Sistem ve bot geliştiricileri — stratejiler için zaman filtresi / zaman büyüklüğü katmanı.
- Kripto ve endeks tüccarları — günler/saatler arasında hızlı davranış kalıpları.
- Yeni başlayanlar — basit okuma: daha yeşil = seçtiğiniz zaman diliminde daha olumlu eğilim.
🚀 Hızlı başlangıç
- Bir Varlık Ön Ayarı seçin (Forex/Kripto/Endeks/Altın).
- Bir Zaman Dilimi ayarlayın (örneğin, 1 Saat HOD için, 1 Gün DOW/Ay için).
- Lookback, Minimum Gözlem ve renkleri ayarlayın.
- En güçlü ipuçları için kümeleri (birkaç bitişik yeşil/kırmızı kutucuk) okuyun.
ℹ️ Mevsimsellik gelecekteki sonuçların garantisi değildir. Bu, dönem ve metodolojiye bağlı istatistiksel bir kalıptır. Göstergeleri giriş/çıkış kurallarınız ve risk yönetiminiz için bağlam olarak kullanın, birden fazla lookback penceresinde sağlamlığı test edin ve düşük n (örneklem büyüklüğü) olan kutulara güvenmekten kaçının.
Özet
The indicator supports multiple asset presets including Forex, Crypto, Indices, and Commodities, and respects the user’s timezone. It applies outlier protection and calculates a robust strength score per time bucket to ensure reliable insights. Users can customize parameters like lookback period, minimum observations, and color schemes.
Atlas is suitable for discretionary traders seeking better timing and sizing, system and bot builders needing a time-based filter or sizing layer, crypto and index traders analyzing behavioral patterns, and beginners looking for a straightforward indication of positive or negative market bias. It provides a statistical context for entry/exit decisions and risk management but should be used alongside other analysis tools.
Müşteri değerlendirmeleri
5 | 50 % | |
4 | 50 % | |
3 | 0 % | |
2 | 0 % | |
1 | 0 % |


!["[Hamster-Coder] Pivot Points MTF" logosu](https://cdn.ctrader.com/image/webp/4c143e5a-309c-40e3-a578-f04d1e133ffa_31159)


