
Açıklama
Market Cipher A, kripto para piyasasındaki makro trendlerin kolay analiz, tanımlama ve tahmini için tasarlanmış gelişmiş bir teknik göstergedir.
Yapı ve Bileşenler
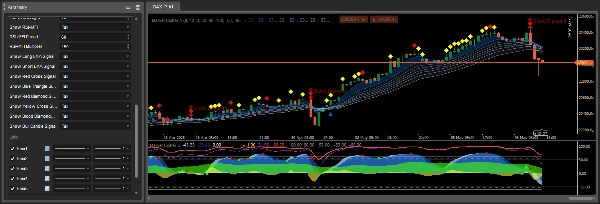
Market Cipher A, piyasa trendine bağlı olarak renk değiştiren 8 üssel hareketli ortalamadan (EMA) oluşan bir şeritten oluşur. EMA şeridi boğa piyasasında mavi veya beyaz, ayı piyasasında ise gri renge döner.
Varsayılan olarak, 5 ile 34 arasındaki EMA değerlerine sahip hareketli ortalamalar kullanılır. Bu çizgilerin kesişimleri çok güçlü gecikmeli göstergeler olabilir, bu yüzden Market Cipher A, her boğa veya ayı kesişiminin manuel yorumlanmasına gerek kalmadan farklı sinyallere karşılık gelen sembolleri otomatik olarak gösterecek şekilde programlanmıştır.
Semboller ve Alım Satım Sinyalleri
Market Cipher A, potansiyel alım satım fırsatlarını gösteren karakteristik sembolleri doğrudan mum grafiği üzerinde gösterir:
Mavi Üçgen - trend dönüş sinyali, azalan momentumu ve yaklaşan dönüşü gösterir. Trendin momentumu azaldığına dair erken bir uyarıdır.
Yeşil Daire - boğa göstergesi, en güvenilir 6 saatlik zaman dilimlerinde ve üzerindedir. Genellikle mavi üçgenden sonra ortaya çıkar ve 1-3 mum aralığında yorumlanmalıdır.
Sarı Elmaslar - yukarı yönlü trendin devamını gösterir. Trend yönünün daha iyi teyidi için EMA şeridi ile birlikte kullanılmalıdır.
Kırmızı Elmaslar - trend zayıflamasını ve olası aşağı yönlü devamı sinyaller. Artan aşağı momentumunu gösterir.
Kırmızı X - ayı göstergesi, en etkili 1 saatlik zaman dilimlerinde ve üzerindedir. EMA şeridi ve kırmızı elmas ile birlikte kullanılmalıdır.
Sarı X - piyasa manipülasyonunu, özellikle hızlıca alınan ve kısa pozisyonlar tarafından satılan büyük uzun pozisyon kapamalarını gösterir.
Büyük Kırmızı Elmas (Kan Elması) - en ayı sinyali olup, özellikle kırmızı X veya daha küçük kırmızı elmas ile birlikte ortaya çıktığında düşüş olasılığının yüksek olduğunu gösterir.
Kullanım İlkeleri
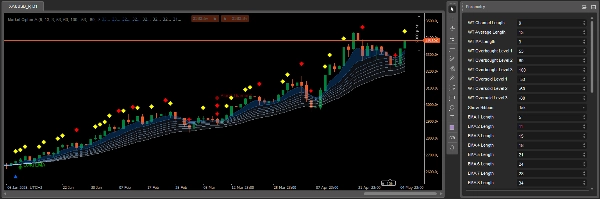
Market Cipher A, ticaret ortamını kolayca anlamayı sağlayan güçlü matematiksel destek veya dirençleri görsel olarak sunar. En iyi Heiken Ashi mumları ile çalışır.
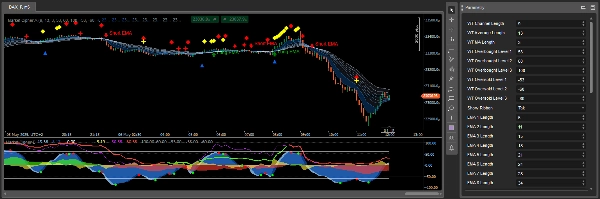
EMA şeridi sadece trendi göstermekle kalmaz, aynı zamanda dinamik destek ve direnç seviyeleri olarak da işlev görür. Şerit mavi/beyaz ve mumlar şeridin üzerindeyse, uzun pozisyon alma fırsatları aranabilir. Şerit gri ve mumlar şeridin altındaysa, kısa pozisyonlar düşünülebilir.
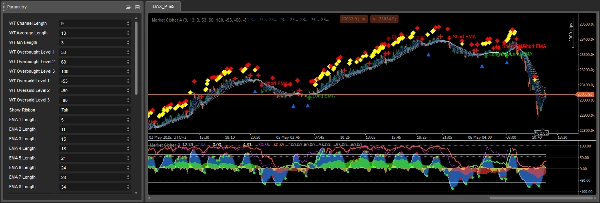
En iyi sonuçlar, Market Cipher A sinyalleri Market Cipher paketindeki diğer göstergelerle, özellikle ek momentum sinyalleri ve giriş noktaları sağlayan Market Cipher B ile birleştirildiğinde elde edilir.
Trend Bağlamında Detaylı Sinyal Yorumu
Market Cipher A'nın önemli bir yönü, baskın trende bağlı olarak bağlamsal sinyal yorumudur. Şerit gri renkten mavi renge döndüğünde, gösterge yukarı yönlü trendin başlangıcı için yeşil bir daire sinyali üretir. Normalde, yeşil daireden sonra gelen 1-3 mumda sarı elmas görünüyorsa, kırılma olasılığı yüksektir. Ancak kırmızı elmaslar ortaya çıkarsa, kırılma olasılığı düşüktür.
Boğa piyasasında sarı elmaslar trendle uyumlu yukarı yönlü devamı gösterirken, kırmızı elmaslar karşı trend hareketini temsil eder. Ayı piyasasında durum tersidir - kırmızı elmaslar düşüşün devamı olarak olumlu, sarı elmaslar ise trende karşı geçici yukarı hareketi gösterir.
Kırmızı X, kırmızı elmasın ardından ve EMA şeridi neredeyse tamamen sıkışmış, ayı gri rengine dönmüş olduğunda en güvenilirdir. Bu göstergenin doğruluğu zaman dilimine bağlı olarak değişir.
Çalışma Mekanizması ve Sinyal Oluşumu
Market Cipher A'daki semboller ve sinyaller, WaveTrend dalga kesişimleri, aşırı alım ve aşırı satım seviyeleri ile RSI ve MFI'nin merkez çizgisini geçmesi veya aşırı alım/aşırı satım durumlarına ulaşması gibi birkaç kaynağa dayanarak oluşturulur. Bu çok boyutlu analiz, sinyalleri tek göstergelerden daha kapsamlı yapar.
EMA şeridi, bireysel bantlar arasında ayrım oluşturan karakteristik bir şerit oluşturan 8 hareketli ortalamadan oluşur. Bantların ayrılması önemli bir faktördür - geniş ayrım güçlü bir trendi, sıkışmış bantlar ise zayıflayan momentumu veya konsolidasyonu gösterir.
Ticaret Stratejilerinde Pratik Uygulama
Market Cipher A öncelikle bir trend analiz aracı olarak tasarlanmıştır, bu yüzden trend takip stratejilerinde en iyi şekilde çalışır. Şeridin diğer trend tanımlama göstergeleriyle birlikte kullanılması ve ardından fiyat geri çekilmeleri sırasında alım satım fırsatlarının aranması önerilir.
Bu sinyallerin, işlemlere giriş veya çıkış zamanlamasını ince ayar yapmaya yardımcı olduğu, ancak tek başına alım satım kararları vermek için kullanılmaması gerektiği unutulmamalıdır. Özellikle yatay fiyat hareketleri sırasında ortaya çıkan dönüş sinyalleri için ek teyitler gereklidir.
Özet
The indicator automatically displays distinct symbols on the price chart to signal potential trading opportunities:
- Blue Triangle: signals declining momentum and possible trend reversal.
- Green Circle: indicates a bullish trend start, most reliable on 6-hour timeframes and above.
- Yellow Diamonds: suggest continuation of an upward trend.
- Red Diamonds: indicate trend weakening and potential downward continuation.
- Red X: bearish signal effective on 1-hour timeframes and higher.
- Yellow X: points to market manipulation events.
- Large Red Diamond ("Blood Diamond"): strong bearish signal with high probability of decline.
Signals are generated using a combination of WaveTrend crossovers, RSI, and MFI indicators, providing multidimensional market analysis. Market Cipher A is optimized for use with Heiken Ashi candles and is best applied within trend-following strategies, ideally combined with other Market Cipher indicators for enhanced entry and momentum confirmation.
Müşteri değerlendirmeleri
5 | 67 % | |
4 | 33 % | |
3 | 0 % | |
2 | 0 % | |
1 | 0 % |


