
Açıklama
Gelişmiş Pro Hacim Profili: Kurumsal Sabit Aralık & Emir Akışı
Piyasa analizlerinizi Gelişmiş Pro Hacim Profili ile yükseltin, tüccarlar için tasarlanmış yüksek optimize edilmiş, kurumsal düzeyde bir gösterge. Müzayede Piyasa Teorisine dayanan günlük tüccarlar, scalperlar ve swing tüccarları için oluşturulan bu araç, Hacim Dağılımı, Değer Alanları ve Emir Akışı dinamiklerine hassasiyet getirir.
Yakınlaştırıp uzaklaştırdığınızda sürekli yeniden hesaplanan, kayan veya bozulan standart perakende hacim profillerinin aksine, bu gösterge Gerçek Çapa Modu (Sabit Aralık) ve hafıza tutma özelliği sunar, bu da onu canlı ticaret ve titiz tarihsel analiz için nihai araç yapar.
🔥 Temel Özellikler & Ticaret Avantajı
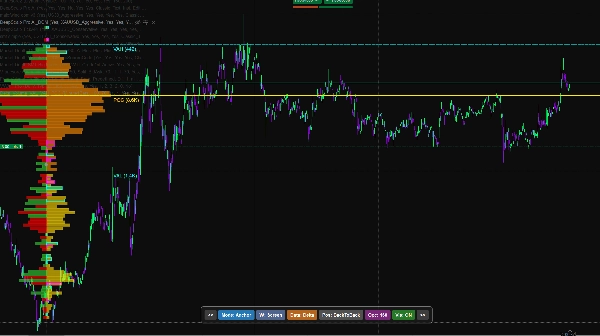
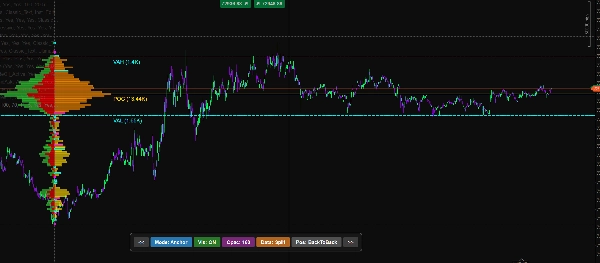
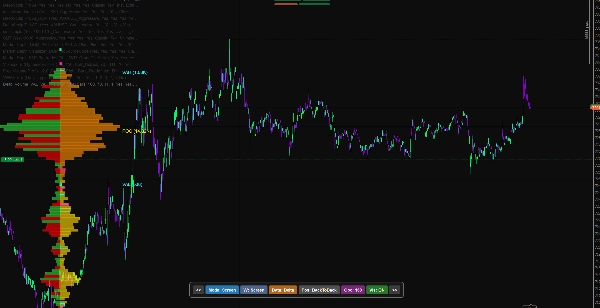
1. Gerçek Çapa Modu (Geriye dönük için mükemmel)
Kaydırılan profillerle uğraşmayı bırakın! Çapa Modumuz ile grafiğinizde istediğiniz yere iki etkileşimli dikey çizgi bırakabilir, belirli bir salınımı, oturumu veya konsolidasyon bölgesini analiz edebilirsiniz.
- Sıfır Bozulma: Yakınlaştırın, uzaklaştırın veya kaydırın—profil seçtiğiniz çapa noktalarına matematiksel olarak kilitli kalır.
- Tarihsel geri dönüş: Aylar veya yıllar geriye kaydırın, profili geçmiş bir piyasa olayına çapalayın ve tam olarak gerçekleştiği gibi hacim dağılımını ve Kontrol Noktasını (POC) analiz edin. Çapalar tam konumlarını hatırlar, böylece ızgara sıfırlanmadan geçmiş düzenlemeleri kusursuzca inceleyebilirsiniz.
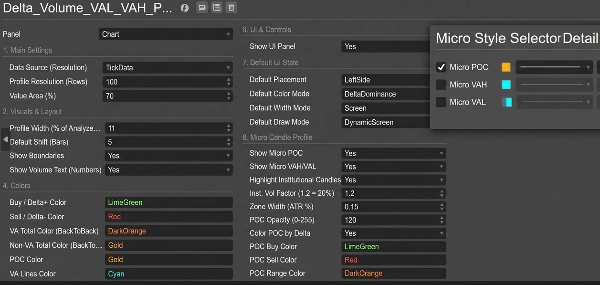
2. Etkileşimli Grafik Üzeri Kullanıcı Arayüzü Paneli
Gösterge ayarlarını sürekli açmanıza gerek yok. Grafiğinizin altında şık, müdahale etmeyen bir kullanıcı arayüzü paneli size şunları sağlar:
- Tek tıklamayla Ekran Modu (Dinamik) ile Çapa Modu (Sabit Aralık) arasında geçiş yapın.
- Profilin konumunu kaydırın (Sol, Sağ, Sırt Sırta).
- Görsel Genişlik ve Opaklığı anında ayarlayın.
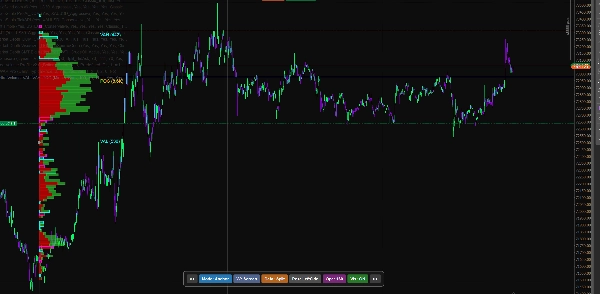
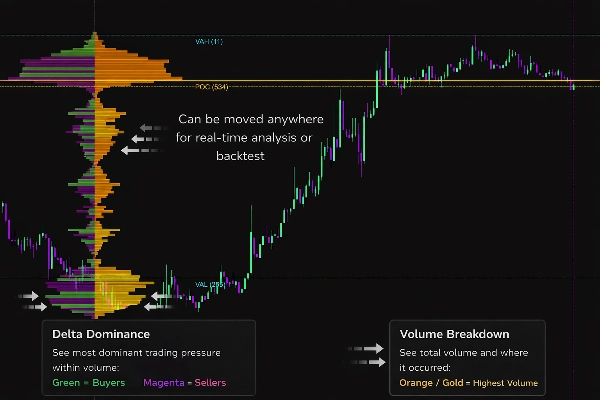
- Alış/Satış Bölünmesi ile Delta Hakimiyeti hacim renklendirmesi arasında geçiş yapın.
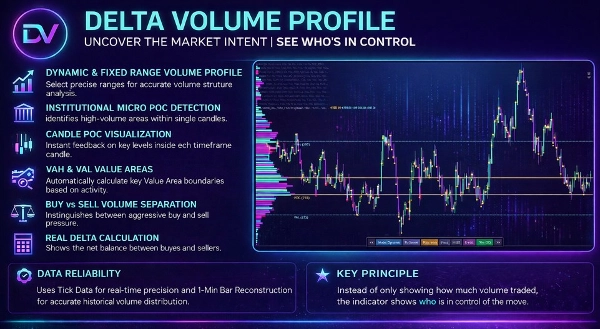
3. Derin Emir Akışı İçgörüleri
Piyasayı profesyonel gibi mikro yapısıyla okuyun:
- Delta Hakimiyeti & Bölünmesi: Her fiyat düğümünde agresif piyasa alımı ve satımını görselleştirin.
- Hacim Dengesizlikleri: Kurumsal absorpsiyon veya agresif kırılmaları tespit etmek için otomatik olarak büyük alış/satış dengesizliklerini (özelleştirilebilir oran, örn. %300 hakimiyet) algılar ve vurgular.
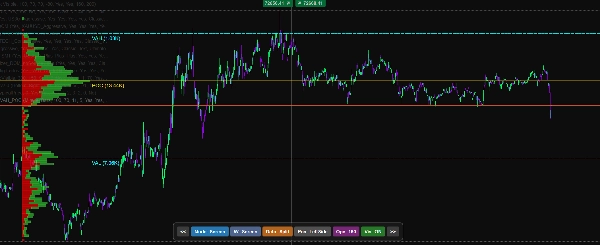
- HVN & LVN Tespiti: Yüksek Hacim Düğümlerini (fiyat için mıknatıslar) ve Düşük Hacim Düğümlerini (fiyatın hızlı hareket ettiği likidite boşlukları) net şekilde tanımlar.
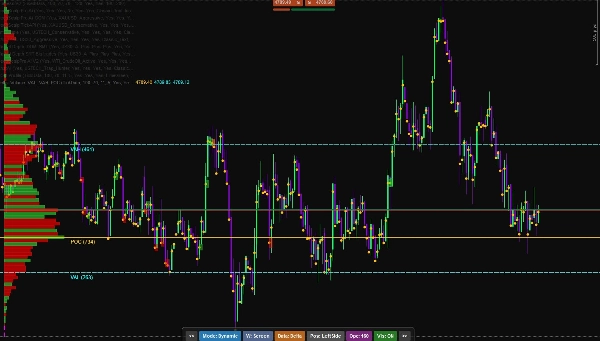
4. Dinamik Değer Alanı & Çıplak POC
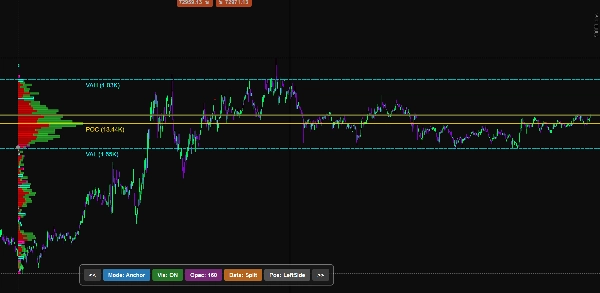
- Standart sapmalara (varsayılan %70) dayalı hassas Değer Alanı Yüksek (VAH) ve Değer Alanı Düşük (VAL) çizgilerini gösterir.
- Kontrol Noktasını (POC) vurgular.
- Çıplak POC'yi Uzat: Kontrol edilmeyen POC çizgilerini otomatik olarak geleceğe uzatır, size son derece tepkisel destek ve direnç hedefleri sağlar.
5. Yüksek Optimizasyonlu
- Veri Kaynakları: Uzun vadeli tarihsel analiz için hiper-doğru Tick Verisi veya hafif 1-Dakikalık Bar verisi arasında seçim yapın.
- Akıllı Render: Platformunuzu donmadan büyük miktarda veriyi işlemek için tasarlanmıştır.
🛠️ Ticaret yapmadığınız zamanlarda öğrenmek için nasıl kullanılır:
- Grafikte istediğiniz tarihe geriye kaydırın.
- Kullanıcı arayüzü panelinde "Mod: Çapa" seçeneğine tıklayın.
- İncelemek istediğiniz tam fiyat salınımını veya ticaret oturumunu kapsayacak şekilde iki dikey noktalı çizgiyi sürükleyin.
- Hacim Profili anında oluşturulur. Profil yerini kaybetmeden tam giriş noktalarını, dengesizlikleri ve Değer Alanı tekrar testlerini incelemek için 1 dakikalık grafiğe yakınlaştırabilirsiniz!
Grafiklerinizin kontrolünü elinize alın. Perakende kalıplarla işlem yapmayı bırakın ve kurumsal hacimle işlem yapmaya başlayın.
Özet
An interactive on-chart UI panel enables quick toggling between dynamic Screen Mode and fixed Anchor Mode, profile position adjustments, visual customization, and switching between Buy/Sell Split and Delta Dominance volume coloring. The tool offers deep order flow insights, including visualization of aggressive buying versus selling, automatic detection of volume imbalances, and identification of High Volume Nodes (HVN) and Low Volume Nodes (LVN).
It displays dynamic Value Area High (VAH), Value Area Low (VAL), and Point of Control (POC) lines, with an option to extend naked POC lines as future support/resistance targets. Users can select data sources between tick data and 1-minute bars for optimized performance and historical analysis. The indicator is engineered for efficient rendering to handle large datasets without platform lag.
Müşteri değerlendirmeleri
5 | 50 % | |
4 | 50 % | |
3 | 0 % | |
2 | 0 % | |
1 | 0 % |


