
Açıklama
Hull Hareketli Ortalama Renkli – Trend Yönü Bir Bakışta
Genel Bakış
Hull Hareketli Ortalama Renkli, Hull Hareketli Ortalama'nın duyarlılığını renk kodlu yön sinyalleriyle uygulayan sadeleştirilmiş bir trend takip göstergesidir. Yükselişleri yeşil, düşüşleri kırmızı renkte göstererek, karmaşık analiz gerektirmeden moment yönünün anında görsel onayını sağlar.
Ne Yapar
Hull Hareketli Ortalama Temeli: Gösterge, gecikmeyi azaltırken pürüzsüzlüğü korumak için tasarlanmış hızlı tepki veren bir hareketli ortalama olan Hull Hareketli Ortalama'yı (HMA) kullanır. Geleneksel hareketli ortalamaların aksine, HMA son fiyat hareketlerine öncelik verir ve bu da trend değişikliklerini erken yakalamada özellikle faydalıdır.
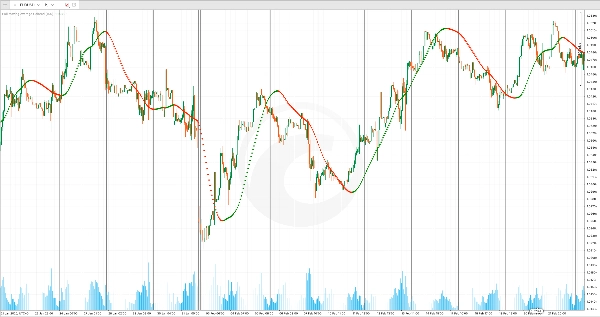
Renk Kodlu Trend Görselleştirme: Tek bir çizgi yerine, gösterge yönsel noktalar çizer:
- Yeşil Noktalar: HMA yükseldiğinde görünür, yukarı yönlü momentumu gösterir
- Kırmızı Noktalar: HMA düştüğünde görünür, aşağı yönlü momentumu gösterir
Bu ikili renk sistemi, eğilim yönünü bir bakışta kesin kılar—eğim yorumlamaya veya önceki çubuklarla karşılaştırmaya gerek yoktur.
Ana Özellikler
Grafik Üzerinde Gösterim: Gösterge doğrudan fiyat grafiğinizde çizilir, böylece trend yönünü gerçek fiyat seviyeleriyle ilişkilendirerek görmenizi sağlar. Bu, fiyatın hareketli ortalamanın üzerine çıkması veya altına inmesi durumlarını kolayca fark etmenizi sağlar ve potansiyel giriş ve çıkış noktalarını işaret eder.
Duyarlı Gecikme Azaltma: Hull Hareketli Ortalama, standart üssel veya basit hareketli ortalamalardan daha hızlı tepki verir, bu da aşırı dalgalanma olmadan zamanında sinyallere ihtiyaç duyan salınım ve günlük işlemciler için özellikle etkilidir.
Basit Özelleştirme: Periyot parametresini ayarlayarak duyarlılığı kontrol edin. Daha kısa periyotlar (örneğin, 20-32) göstergenin son hareketlere daha duyarlı olmasını sağlar ancak dalgalı piyasalarda yanlış sinyallere daha yatkındır. Daha uzun periyotlar (örneğin, 64-128) daha az yanlış kırılma ile daha pürüzsüz trendler sunar ancak hızlı dönüşleri kaçırabilir.
Pratik Kullanım
Hull Hareketli Ortalama Renkli'yi işlem yönü için hızlı bir filtre olarak kullanın. Yeşil noktalar görünürken ve fiyat ortalamanın üzerindeyse sadece uzun işlemler yapın; kırmızı noktalar görünürken ve fiyat ortalamanın altındaysa sadece kısa işlemler yapın. Tersine, renk değişikliklerini potansiyel çıkış sinyalleri olarak değerlendirin—yeşilden kırmızıya geçişte uzun pozisyonlarınızı yeniden değerlendirme zamanı gelmiştir.
Gösterge, trend piyasalarında iyi çalışır ve özellikle daha yüksek zaman dilimlerinde (4 saatlik ve günlük) faydalıdır; böylece daha düşük zaman dilimi kurulumlarını işlemeye başlamadan önce daha geniş yön eğilimiyle uyum sağlamanıza yardımcı olur.
Özet
This indicator overlays directly on price charts and uses a binary color system to indicate trend direction: green points appear when the HMA is rising, signaling upward momentum, and red points appear when the HMA is falling, signaling downward momentum. This visual approach allows traders to quickly identify trend direction without interpreting slopes or comparing previous bars.
Users can adjust the period parameter to control sensitivity—shorter periods increase responsiveness but may generate more false signals, while longer periods smooth trends but may delay signals. The indicator is suitable for various markets including Forex, indices, stocks, and cryptocurrencies such as BTCUSD and XAUUSD. It is particularly useful on higher timeframes (4-hour and daily) for aligning with broader market trends and can assist in identifying potential entry and exit points based on trend changes.
Müşteri değerlendirmeleri
5 | 0 % | |
4 | 100 % | |
3 | 0 % | |
2 | 0 % | |
1 | 0 % |


