
Açıklama
Niceliksel Niteliksel Tahmin (QQE) Çok Zaman Dilimli Gösterge
Niceliksel Niteliksel Tahmin (QQE göstergesi), düzleştirilmiş hareketli ortalamalar ekleyerek Göreceli Güç Endeksi (RSI)’ni geliştiren teknik analiz aracıdır. Tüccarların trend gücünü, potansiyel dönüşleri ve aşırı alım/aşırı satım koşullarını daha yüksek doğrulukla değerlendirmelerine yardımcı olur.
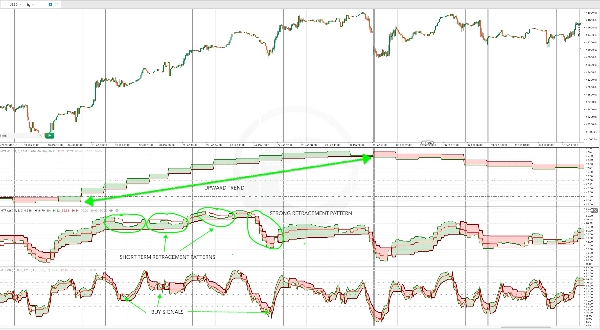
QQE, dinamik destek ve direnç olarak işlev gören hızlı ve yavaş takip eden durdurma seviyeleri olmak üzere iki ana bileşene sahiptir. Bu, onu hem trend takibi hem de ortalamaya dönüş stratejileri için çok yönlü bir araç yapar. QQE çizgisi ile sinyal çizgisi arasındaki kesişim genellikle potansiyel alım veya satım fırsatlarını gösterir.
Çok Zaman Dilimli QQE: Gelişmiş Bir Versiyon
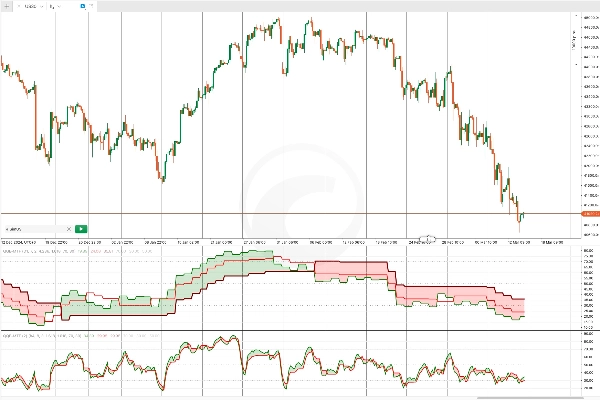
QQE göstergesinin bu geliştirilmiş versiyonu, hem hızlı hem de yavaş trend çizgilerini entegre eden çok zaman dilimli bir araç olarak tasarlanmıştır ve hassasiyeti artırır. Fiyat hareketini birden fazla zaman diliminde analiz ederek, piyasa trendlerinin kapsamlı bir görünümünü sağlar.
Gelişmiş düzleştirme algoritması güvenilirliğini artırır ve onu aşağıdaki amaçlar için etkili bağımsız bir gösterge yapar:
✅ Trend yönünü belirleme
✅ Kesin giriş ve çıkış sinyalleri oluşturma
✅ Aşırı alım ve aşırı satım koşullarını tespit etme
Çok Zaman Dilimli QQE’nin esnekliği, onu hem trend takibi hem de dönüş stratejileri için uygun kılar.
Çok Zaman Dilimli QQE Nasıl Kullanılır
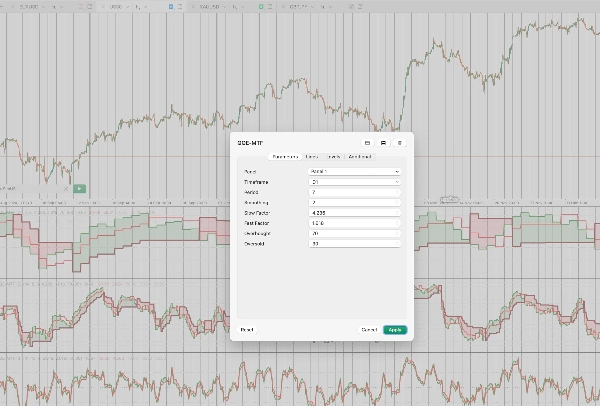
Çok Zaman Dilimli QQE’yi yapılandırmak için, tüccarlar şunları seçmelidir:
🔹 Bir zaman dilimi (örneğin, Günlük, H4, H1)
🔹 Periyotlar (hesaplamada kullanılan mum sayısı)
🔹 Bir düzleştirme periyodu (RSI düzleştirmesi için)
🔹 Yavaş ve hızlı faktörler (hassasiyeti ayarlamak için)
🔹 Özelleştirilebilir aşırı alım ve aşırı satım seviyeleri
📌 Not: Bu çok zaman dilimli bir gösterge olduğundan, grafik ekledikten sonra, göstergenin düzgün şekilde yüklenmesi ve başlatılması için cTrader arayüzünde uzaklaştırma yapmak önemlidir.
Çok Zaman Dilimli QQE ile Ticaret Stratejileri
1️⃣ Yüksek Zaman Dilimi Trend Onayı için QQE
Çok Zaman Dilimli QQE’yi kullanmanın etkili bir yolu, daha yüksek zaman diliminde trend onayı yaparken, daha düşük zaman diliminde geri çekilme girişlerini belirlemektir.
Örneğin:
- Güçlü bir trendi onaylamak için günlük zaman dilimindeki QQE kullanılır.
- Geri çekilme girişleri, Stokastik Osilatör aşırı alım veya aşırı satım seviyelerini geçtiğinde belirlenir.
Bu yöntem, tüccarların girişlerini genel trendle uyumlu hale getirmelerine yardımcı olur.
2️⃣ Daha Derin Piyasa İçgörüleri için Çok Zaman Dilimli Analiz
QQE’yi birden fazla zaman diliminde kullanmak, tüccarların bir varlığın davranışını daha ayrıntılı anlamalarını sağlar.
Örneğin, QQE’yi uygulayarak:
📊 Günlük zaman dilimi (D1): Genel trend yönünü belirler.
📊 4 saatlik zaman dilimi (H4): Trend yönünü onaylar ve kısa vadeli geri çekilmeleri tanımlar.
📊 1 saatlik zaman dilimi (H1): Aşırı alım/aşırı satım koşullarına veya karşı trend hareketlerine dayalı kesin giriş sinyalleri üretir.
Bu yapılandırılmış yaklaşım, farklı zaman dilimlerinde sinyalleri hizalayarak ticaret zamanlamasını ve karar vermeyi geliştirir.
Özet
This advanced multi-timeframe tool integrates fast and slow trend lines to analyze price action across different timeframes, providing a comprehensive view of market trends. Its smoothing algorithm improves reliability, making it effective for identifying trend direction, generating precise entry and exit signals, and detecting overbought/oversold levels.
Users configure the indicator by selecting a timeframe (e.g., Daily, H4, H1), periods for calculation, smoothing period for RSI, sensitivity factors, and customizable overbought/oversold thresholds. It is recommended to zoom out in the cTrader interface after adding the indicator to allow sufficient data loading.
Typical strategies include using the QQE on higher timeframes for trend confirmation and on lower timeframes for entry timing, as well as multi-timeframe analysis to enhance trade timing and decision-making by aligning signals across timeframes.
Müşteri değerlendirmeleri
5 | 50 % | |
4 | 50 % | |
3 | 0 % | |
2 | 0 % | |
1 | 0 % |


