
الوصف
✅ يتم توفير UATKit مجانًا كمساهمة حسن نية لمجتمع cTrader، تم إنشاؤه بواسطة متداول محترف يفهم التحديات اليومية لتحليل الرسوم البيانية والتنفيذ.
⚠️يرجى التحقق من صفحة المنتج بشكل دوري للحصول على التحديثات، حيث لا يقوم cTrader بإخطار المستخدمين عند إصدار نسخ جديدة من المؤشرات.
⭐️ سأكون سعيدًا أيضًا بتلقي تعليقاتكم وملاحظاتكم في مراجعات العملاء و قسم المناقشة.
1. ما هو هذا المنتج
مجموعة أدوات شاملة لتحسين سير العمل مصممة لجعل الرسم البياني على cTrader أكثر سلاسة ووضوحًا وكفاءة.
مجموعة أدوات المساعد الشامل (UATKit) هي رفيق متعدد الميزات على جانب الرسم البياني لـ cTrader.
يجمع بين عدة أدوات عملية - كل منها مصمم لحل حاجة محددة في سير العمل - في مؤشر موحد وخفيف الوزن.
كل ميزة في UATKit قابلة للتخصيص بالكامل وتعمل بشكل مستقل، مما يمنح المتداولين السيطرة الكاملة لضبط السلوك، والمظاهر، ومفاتيح الاختصار مع تمكين الأدوات التي يحتاجونها فقط لتجربة رسم بياني نظيفة وسريعة الاستجابة.
يتم توفير UATKit مجانًا كمساهمة حسن نية لمجتمع cTrader، تم إنشاؤه بواسطة متداول محترف يفهم التحديات اليومية لتحليل الرسوم البيانية والتنفيذ.
2. لمن هذه المجموعة من الأدوات
تم بناء UATKit للمتداولين الذين:
- يقضون وقتًا كبيرًا في تحليل الرسوم البيانية
- يفضلون تخطيطات رسوم بيانية نظيفة، معلوماتية، وقابلة للتخصيص
- يريدون وصولًا أسرع إلى الإجراءات الشائعة عبر مفاتيح الاختصار
- يحتاجون إلى وضوح بصري أثناء الأسواق سريعة الحركة
- يقدرون الأدوات التي تعزز سير العمل دون إضافة ضوضاء
سواء كنت تقوم بالتداول السريع، التداول المتأرجح، أو ببساطة تريد بيئة رسم بياني أكثر تنظيمًا، يتكيف UATKit مع أسلوبك.
3. نظرة عامة على مجموعات الميزات
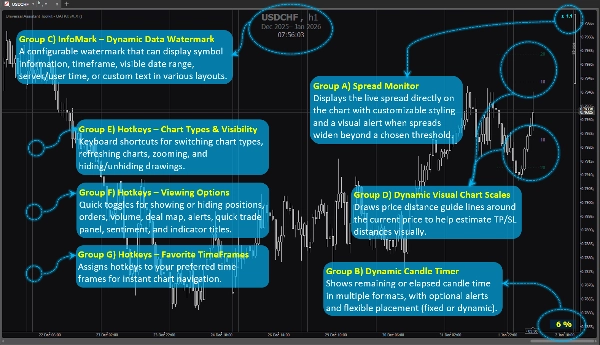
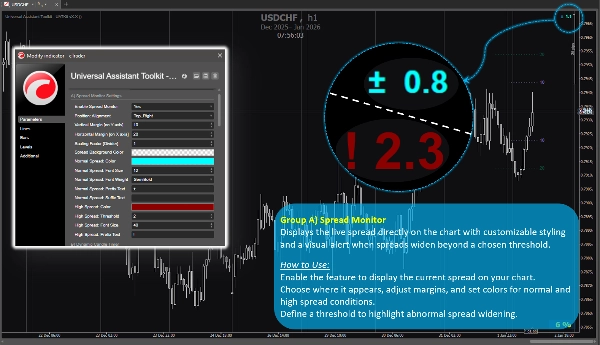
مجموعة الميزات أ) 🔸 مراقب الفارق السعري
يعرض الفارق السعري المباشر مباشرة على الرسم البياني مع تنسيق قابل للتخصيص وتنبيه بصري عند اتساع الفارق السعري فوق حد معين.
كيفية الاستخدام:
قم بتمكين الميزة لعرض الفارق الحالي على الرسم البياني الخاص بك.
اختر مكان ظهوره، اضبط الهوامش، وحدد الألوان للحالات العادية والعالية للفارق السعري.
حدد حدًا لتسليط الضوء على اتساع الفارق غير الطبيعي.
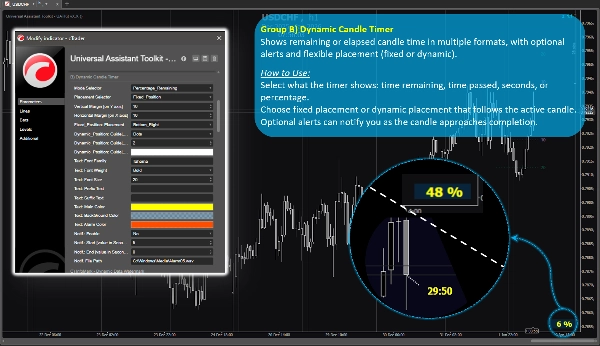
مجموعة الميزات ب) 🔸 مؤقت الشمعة الديناميكي
يعرض الوقت المتبقي أو المنقضي للشمعة بعدة تنسيقات، مع تنبيهات اختيارية ومكان مرن (ثابت أو ديناميكي).
كيفية الاستخدام:
اختر ما يعرضه المؤقت: الوقت المتبقي، الوقت المنقضي، الثواني، أو النسبة المئوية.
اختر مكانًا ثابتًا أو مكانًا ديناميكيًا يتبع الشمعة النشطة.
يمكن للتنبيهات الاختيارية إعلامك عند اقتراب انتهاء الشمعة.
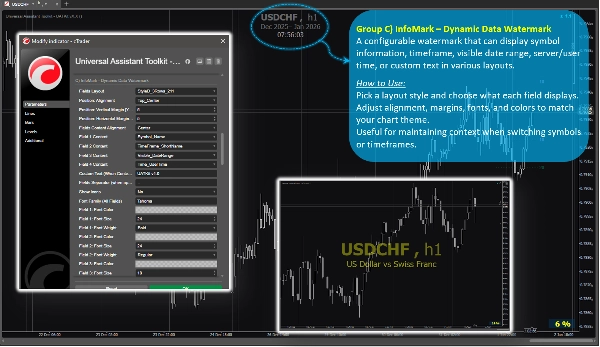
مجموعة الميزات ج) 🔸 InfoMark – علامة مائية ديناميكية للبيانات
علامة مائية قابلة للتكوين يمكنها عرض معلومات الرمز، الإطار الزمني، نطاق التاريخ المرئي، وقت الخادم/المستخدم، أو نص مخصص بتنسيقات مختلفة.
كيفية الاستخدام:
اختر نمط التخطيط وحدد ما يعرضه كل حقل.
اضبط المحاذاة، الهوامش، الخطوط، والألوان لتتناسب مع موضوع الرسم البياني الخاص بك.
مفيد للحفاظ على السياق عند تبديل الرموز أو الأطر الزمنية.
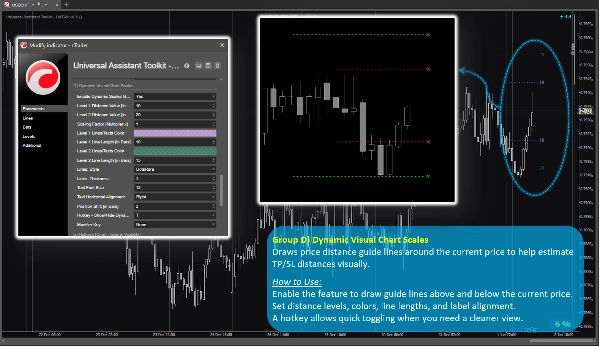
مجموعة الميزات د) 🔸 مقاييس الرسم البياني البصرية الديناميكية
يرسم خطوط إرشادية لمسافة السعر حول السعر الحالي لمساعدتك في تقدير مسافات TP/SL بصريًا.
كيفية الاستخدام:
قم بتمكين الميزة لرسم خطوط إرشادية فوق وتحت السعر الحالي.
حدد مستويات المسافة، الألوان، أطوال الخطوط، ومحاذاة التسميات.
مفتاح اختصار يسمح بالتبديل السريع عندما تحتاج إلى عرض أنظف.
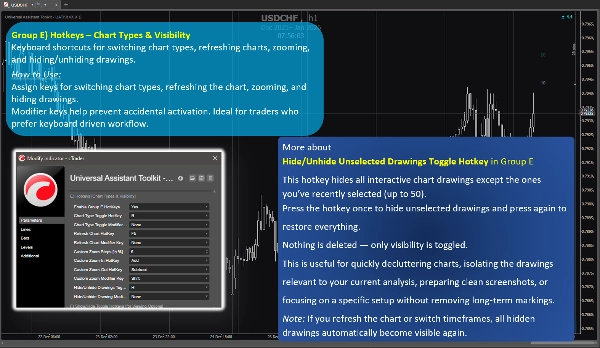
مجموعة الميزات هـ) 🔸 مفاتيح الاختصار – أنواع الرسوم البيانية والرؤية
اختصارات لوحة المفاتيح لتبديل أنواع الرسوم البيانية، تحديث الرسوم، التكبير، وإخفاء/إظهار الرسومات.
كيفية الاستخدام:
قم بتعيين مفاتيح لتبديل أنواع الرسوم البيانية، تحديث الرسم، التكبير، وإخفاء الرسومات.
مفاتيح التعديل تساعد في منع التفعيل العرضي. مثالي للمتداولين الذين يفضلون سير عمل يعتمد على لوحة المفاتيح.
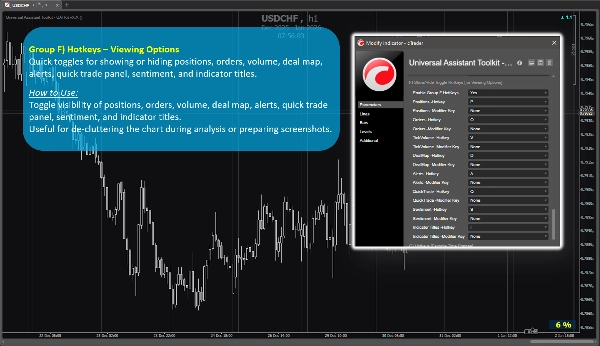
مجموعة الميزات و) 🔸 مفاتيح الاختصار – خيارات العرض
تبديلات سريعة لإظهار أو إخفاء المراكز، الأوامر، الحجم، خريطة الصفقات، التنبيهات، لوحة التداول السريع، المعنويات، وعناوين المؤشرات.
كيفية الاستخدام:
قم بالتبديل بين إظهار أو إخفاء المراكز، الأوامر، الحجم، خريطة الصفقات، التنبيهات، لوحة التداول السريع، المعنويات، وعناوين المؤشرات.
مفيد لتنظيف الرسم البياني أثناء التحليل أو تحضير لقطات الشاشة.
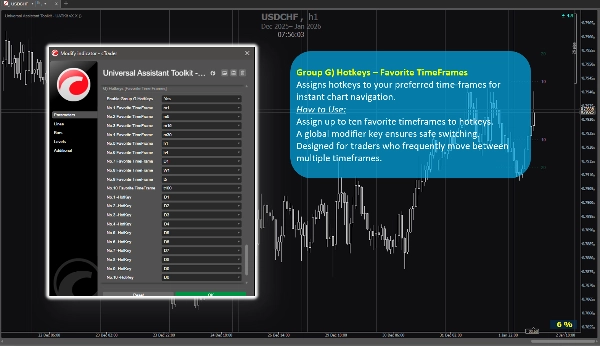
مجموعة الميزات ز) 🔸 مفاتيح الاختصار – الأطر الزمنية المفضلة
تعيين مفاتيح اختصار للأطر الزمنية المفضلة لديك للتنقل الفوري في الرسم البياني.
كيفية الاستخدام:
قم بتعيين ما يصل إلى عشرة أطر زمنية مفضلة لمفاتيح الاختصار.
مفتاح تعديل عام يضمن التبديل الآمن.
مصمم للمتداولين الذين ينتقلون بشكل متكرر بين أطر زمنية متعددة.
4. ملاحظات إضافية للمستخدمين
- جميع الميزات اختيارية ويمكن تمكينها أو تعطيلها بشكل فردي.
- تم تحسين مجموعة الأدوات للأداء وصممت لتجنب التداخل مع المؤشرات الأخرى.
- تتضمن معظم المعلمات تلميحات مدمجة. ببساطة مرر المؤشر فوق أي إعداد لعرض إرشادات إضافية وملاحظات الاستخدام.
- لا يتم استخدام مصادر بيانات خارجية؛ جميع المعلومات تأتي من الرسم البياني والمنصة.
- يتم توفير هذه المجموعة من الأدوات مجانًا لدعم مجتمع cTrader وتحسين سير عمل الرسم البياني اليومي.
- الإعدادات الافتراضية معقولة، لذا يمكن للمستخدمين الذين لا يحتاجون إلى تكوينات خاصة الاعتماد على المعلمات المسبقة دون قضاء وقت إضافي في الإعداد.
- ⭐️ التعليقات والاقتراحات مرحب بها للمساعدة في تحسين الإصدارات المستقبلية (استخدم قسم المناقشة في هذه الصفحة).
- ⚠️يرجى التحقق من صفحة المنتج بشكل دوري للحصول على التحديثات، حيث لا يقوم cTrader بإخطار المستخدمين عند إصدار نسخ جديدة من المؤشرات.
الملخص
Key features include:
- **Spread Monitor:** Displays live spread on the chart with customizable visuals and alerts for spread widening.
- **Dynamic Candle Timer:** Shows remaining or elapsed candle time in various formats, with optional alerts and flexible positioning.
- **InfoMark Watermark:** Configurable watermark displaying symbol info, timeframe, date range, server/user time, or custom text.
- **Dynamic Visual Chart Scales:** Price-distance guide lines around current price to estimate take-profit/stop-loss distances visually.
- **Hotkeys for Chart Types & Visibility:** Keyboard shortcuts for switching chart types, refreshing, zooming, and toggling drawing visibility.
- **Hotkeys for Viewing Options:** Quick toggles for positions, orders, volume, deal map, alerts, quick trade panel, sentiment, and indicator titles.
- **Hotkeys for Favorite TimeFrames:** Assign up to ten favorite timeframes to hotkeys for instant navigation.
All features are optional and configurable, optimized for performance without interfering with other indicators. UATKit supports various markets including Forex, indices, commodities, crypto, and stocks. It is intended for traders who seek a clean, customizable, and efficient charting environment with enhanced workflow controls.
تقييمات العملاء
5 | 100 % | |
4 | 0 % | |
3 | 0 % | |
2 | 0 % | |
1 | 0 % |


![شعار "[Hamster-Coder] Bollinger Bands"](https://cdn.ctrader.com/image/webp/21d8e5d6-fb11-4bac-b9ee-cd05c2b76804_30327)


