
説明
BLOCK LIQUIDITYインジケーターは、市場分析の2つの主要なアプローチを組み合わせています:
オーダーブロック検出:
ルックバック期間内の破られていない高値と安値に基づいてサポートとレジスタンスの領域を特定します。
価格が破られていない安値を上回って終値をつけたときに買いシグナルを生成します。
価格が破られていない高値を下回って終値をつけたときに売りシグナルを生成します。
流動性分析:
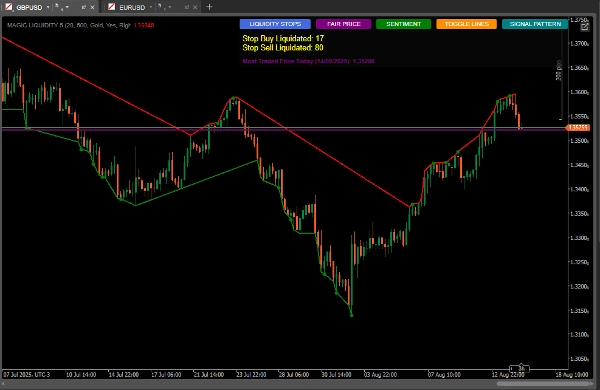
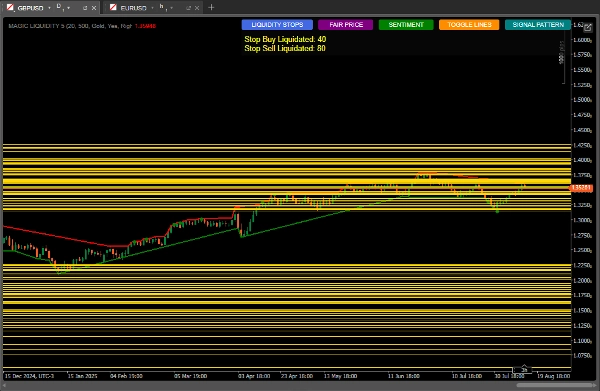
流動性プール(ストップロスが集中している可能性のある領域)を検出します。
買いおよび売りのストップの発動を監視します。
流動性の分布に基づいて市場センチメントを計算します。
最も取引された価格(公正価格)を特定します。
最良の結果を得るための使い方
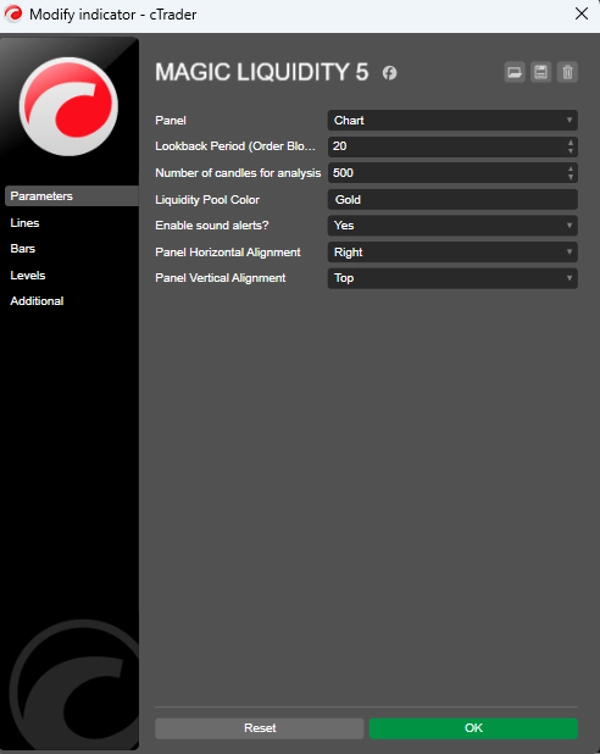
初期設定
ルックバック期間:取引している時間枠に応じて「Lookback Period」パラメータを調整します(高い時間枠には高い値を設定)。
分析用のキャンドル数:堅牢な分析には500のままにし、より速い反応が必要な場合は減らします。
流動性プールの色:チャート上で目立つ色を選択してください。
シグナルの解釈
オーダーブロックシグナル:
緑の点:価格が破られていない安値を上回って終値をつけたときの買いシグナル。
赤の点:価格が破られていない高値を下回って終値をつけたときの売りシグナル。
流動性プール:
水平線は流動性のある領域(潜在的なターゲットまたは反転ポイント)を示します。
現在の価格の上/下の流動性の関係を監視します。
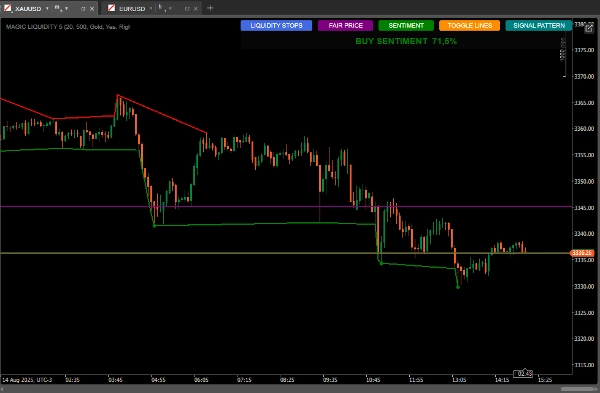
市場センチメント:
「SENTIMENT」ボタンを使って、支配的な方向と信頼度を確認します。
高い信頼度の買いセンチメントは継続的な成長を示唆し、高い信頼度の売りセンチメントは弱気の継続を示唆します。
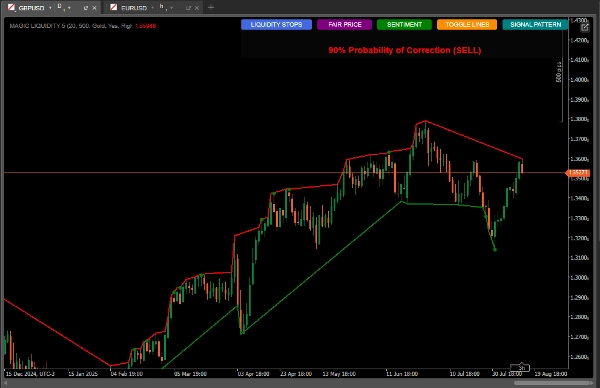
ローソク足パターン:
「SIGNAL PATTERN」ボタンは分析し、
定量的比率に基づく修正の確率を表示します
最も取引された価格(公正価格):
「FAIR PRICE」ボタンは、その日の最も取引量の多い価格レベルを表示します。
価格の磁石として、またはサポート/レジスタンスとして機能することがあります。
使用戦略
保守的戦略:
オーダーブロックシグナルが支配的なセンチメントと一致するときのみ取引します。
流動性プールを利益確定のターゲットとして使用します。
積極的戦略:
価格が多くのストップが蓄積された流動性プールに近づくと反転を予測します。
センチメントと価格アクションの乖離を利用して逆トレンド取引を行います。
追加の確認:
インジケーターが示すローソク足パターンと比較します。
公正価格が近くにあるかどうかを関心領域として確認します。
リスク管理。
ストップロス:
買いの場合は直近のオーダーブロックの下に設定します
売りの場合は直近のオーダーブロックの上に設定します
利益確定:
近くの流動性プールをターゲットにします
ターゲット設定には上/下の流動性比率を考慮します
高度なヒント
チャートが混雑したときは「TOGGLE LINES」ボタンで流動性ラインを無効にします
動きの強さを評価するために清算されたストップの数を監視します
公正価格は、動的なサポート/レジスタンスのようなレンジ相場で特に有用です
他のインジケーター(ボリューム、移動平均)と組み合わせて確認に使います
インジケーターのボリューム:
https://ctrader.com/pt/products/635
概要
Users can customize parameters such as lookback period and number of candles analyzed to suit different timeframes and trading styles. Visual signals include green and red dots for buy and sell order block signals, and horizontal lines marking liquidity pools. Additional features include sentiment indication with confidence levels, candlestick pattern analysis for correction probabilities, and toggling of liquidity lines for chart clarity.
Recommended strategies include trading in the direction of order block signals aligned with sentiment for conservative approaches, or anticipating reversals near liquidity pools for aggressive trades. Risk management is supported by placing stop-loss orders relative to recent order blocks and setting take-profit targets at liquidity pools. The indicator can be combined with other tools like volume and moving averages for confirmation.
カスタマーレビュー
5 | 100 % | |
4 | 0 % | |
3 | 0 % | |
2 | 0 % | |
1 | 0 % |


