
Beschreibung
PVA (Price-Volume-Analyse) ist ein technischer Analyseansatz, der die Beziehung zwischen dem Preis und dem Handelsvolumen eines Finanzinstruments untersucht. Die Kernidee hinter PVA ist, dass das Handelsvolumen wichtige Informationen über die Stärke und Richtung eines Trends liefern kann, was Händlern hilft, fundiertere Entscheidungen zu treffen.
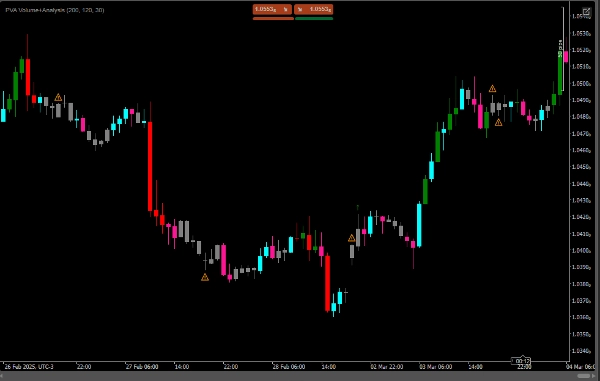
-Steigendes Volumen bei steigendem Preis: Zeigt einen starken Aufwärtstrend an, und ein grünes Symbol (Pfeil nach oben) wird angezeigt.
-Steigendes Volumen bei fallendem Preis: Zeigt einen starken Abwärtstrend an, und ein rotes Symbol (Pfeil nach unten) wird angezeigt.
-Abnehmendes Volumen bei steigendem Preis: Zeigt an, dass der Aufwärtstrend an Stärke verlieren könnte, und eine orangefarbene Warnung (Warnsymbol) wird angezeigt.
-Abnehmendes Volumen bei fallendem Preis: Zeigt an, dass der Abwärtstrend an Stärke verlieren könnte, und ebenfalls eine orangefarbene Warnung (Warnsymbol) wird angezeigt.
-Fällt das Volumen bei einer Aufwärts- oder Abwärtsbewegung, wird ein Warnzeichen (⚠️) gezeichnet.
Zusammenfassung
- A green up arrow appears when volume increases alongside rising prices, indicating a strong uptrend.
- A red down arrow signals a strong downtrend when volume increases as prices fall.
- An orange warning symbol alerts when volume decreases during rising or falling prices, suggesting the current trend may be weakening.
- A general alert mark (⚠️) is displayed if volume declines during either upward or downward price movements.
This indicator assists traders by highlighting the interplay between price and volume, offering insights into the momentum behind market trends. It is designed for use in technical analysis to support more informed trading decisions.
Kundenbewertungen
5 | 100 % | |
4 | 0 % | |
3 | 0 % | |
2 | 0 % | |
1 | 0 % |


![„Gaussian Channel [Iridio Capital]“-Logo](https://cdn.ctrader.com/image/webp/7c039209-5573-4a54-a072-f9528b503103_41960)


