Beschreibung
Wal-Liquiditäts- & Absorptionsprofil
Verfolgen Sie institutionelles Geld, analysieren Sie den Orderfluss und erkennen Sie Umkehrzonen mit volumetrischer Präzision
Das Wal-Liquiditäts- & Absorptionsprofil ist kein traditionelles Volumenprofil. Es ist eine Markt-Mikrostruktur-Analyse-Suite, die jede Transaktion aufschlüsselt, um Ihnen nicht nur zu zeigen, wo Volumen gehandelt wurde, sondern wer es gehandelt hat (institutionell vs. privat) und wie der Preis auf diesen Ebenen interagierte (Aggression vs. Absorption).
Es verfügt über eine optimierte Rendering-Engine, die alle Daten rechts vom aktuellen Preis projiziert und so Ihr Chart vollständig sauber und verzögerungsfrei hält.
Hauptmerkmale
- Stärkefilter (nur Wale): Verwendet einen Perzentil-Algorithmus (z.B. Top 97%), um institutionelles („starkes“) Volumen vom privaten („schwachen“) Volumen zu trennen. Sie können den Modus „Nur Stark“ umschalten, um ausschließlich den Fußabdruck von Smart Money zu verfolgen.
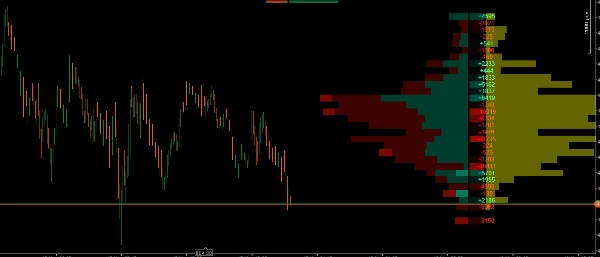
- Gestapeltes Volumenprofil: Zeigt visuell die Verteilung von bullischem und bärischem Volumen pro Preisniveau an, was es einfach macht, den Point of Control (POC) und die Hoch-/Tief-Volumenknoten (HVN/LVN) zu identifizieren.
- Automatische Erkennung des Wertbereichs: Hebt die Preisniveaus hervor, bei denen der höchste Prozentsatz des Volumens gehandelt wurde (Standard 70%), und dimmt die äußeren Zonen, um den Marktkontext auf einen Blick leicht lesbar zu machen.
- Delta-Profil (Heatmap): Berechnet die genaue Differenz zwischen Markt-Käufen und Markt-Verkäufen auf jedem Preisniveau. Es enthält numerische Werte und eine visuelle Heatmap, um schnell zu erkennen, wer aggressiv die Kontrolle hat.
- Absorptionsprofil (gelbe Zonen): Misst das Volumen, das speziell innerhalb von Kerzendochten gefangen ist. Dies ermöglicht es Ihnen, grafisch genau zu sehen, wo Smart Money passiv Liquidität von gefangenen Privatanlegern absorbiert.
- Optimierte Leistung: Schwere volumetrische Berechnungen werden nur auf der neuesten Kerze verarbeitet, wodurch Ihre cTrader-Plattform auch bei niedrigeren Zeitrahmen reibungslos und effizient läuft.
Wie verwendet man diesen Indikator im Trading?
Dieser Indikator bietet 3 Bestätigungsebenen für Ihre Trades. So kombinieren Sie sie effektiv:
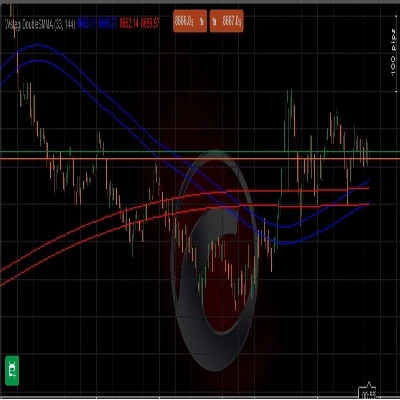
1. Definieren Sie den Kontext mit dem Volumenprofil & Wertbereich
- Verwenden Sie das Volumenprofil, um zu erkennen, wo die Preisakzeptanz am höchsten ist (Wertbereich und POC).
- Strategie: Suchen Sie Kaufgelegenheiten am unteren Ende des Wertbereichs (Unterstützung) und Verkaufsgelegenheiten am oberen Ende des Wertbereichs (Widerstand).
2. Bewerten Sie die Aggression mit dem Delta-Profil
- Wenn der Preis Ihr Schlüssel-Level erreicht (z.B. eine Unterstützungszone), schauen Sie auf die Delta-Spalte.
- Strategie: Wenn Sie einen Kauf bei Unterstützung suchen, möchten Sie ein stark positives (grünes) Delta auf diesem Niveau sehen, was darauf hinweist, dass Käufer aggressiv eingreifen. Bleibt das Delta stark negativ, dominieren weiterhin Verkäufer.
3. Finden Sie den perfekten Auslöser mit dem Absorptionsprofil (der Kern des Indikators)
- Hier zeigt das Tool seine wahre Stärke. Oft sieht der Markt aus, als würde er stark fallen (stark negatives Delta), doch der Preis hört auf zu fallen. Warum? Weil die „Wale“ Limit-Orders verwenden, um die gesamte Verkaufsdruckabsorption zu übernehmen.
- Strategie (Umkehr-Trade): Wenn Sie sehen, dass der Preis in ein kritisches Niveau fällt und das Delta negativ ist (gefangene Privatanleger-Verkäufer), aber plötzlich ein großer gelber Balken im Absorptionsprofil erscheint, bedeutet dies, dass Institutionen gerade alle Liquidität in diesem Docht absorbiert haben. Dies ist Ihr optimaler Auslöser, um in die entgegengesetzte Richtung einzusteigen!
4. Verwenden Sie den „Stärkefilter“, um das Rauschen zu durchdringen
- Wenn sich der Markt konsolidiert und die Richtung unklar ist, schalten Sie die „Nur Stark“-Option ein. Dies blendet alle irrelevanten privaten Geräusche aus und zeigt Ihnen genau, wo große Fonds ihre Positionen akkumulieren oder verteilen.
Zusammenfassung
A Delta Profile heatmap calculates the net difference between market buys and sells at each price level, showing buyer or seller aggression. The Absorption Profile identifies volume trapped in candlestick wicks, revealing where institutional traders absorb liquidity from retail participants. The indicator’s optimized engine processes heavy volumetric calculations only on the latest candle, ensuring smooth performance on the cTrader platform.
Traders can use this tool to define market context, evaluate buying or selling aggression, and pinpoint reversal triggers based on absorption patterns. The "Strong Only" mode filters out retail noise during consolidation phases, focusing on institutional accumulation or distribution zones. This indicator supports volume and DOM data visualization to enhance decision-making around key support and resistance levels.
Kundenbewertungen
5 | 100 % | |
4 | 0 % | |
3 | 0 % | |
2 | 0 % | |
1 | 0 % |