
Beschreibung
Heatmap-Liquiditätszonen
Visualisieren Sie Volumen-zu-Preis, entdecken Sie versteckte Unterstützungs-/Widerstandszonen und verfolgen Sie die Marktliquidität in Echtzeit.
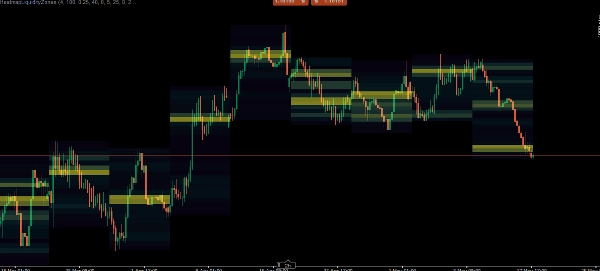
Der Heatmap-Liquiditätszonen-Indikator ist ein leistungsstarkes Volumenprofilierungswerkzeug, das rohe Marktdaten in eine intuitive visuelle Heatmap übersetzt. Durch die Analyse des Tick-Volumens über spezifische höhere Zeitrahmen (HTF) identifiziert er genau, wo der bedeutendste Kauf- und Verkaufsdruck konzentriert ist.
Anstatt zu raten, wo sich der Markt umkehren könnte, zeichnet dieser Indikator präzise, volumenbasierte Liquiditätsniveaus ein. Diese Niveaus erstrecken sich dynamisch nach vorne und verschwinden automatisch, sobald der Preis sie durchbricht und ungültig macht, wodurch Ihr Chart sauber und strikt relevant für die aktuelle Kursbewegung bleibt.
Hauptmerkmale
Multi-Timeframe-Heatmap: Wählen Sie Ihren bevorzugten Makro-Zeitrahmen (1H, 4H, täglich, wöchentlich oder monatlich). Der Indikator bildet die Volumenverteilung für diesen spezifischen Zeitraum direkt auf Ihren niedrigeren Zeitrahmen-Charts ab.
Dynamische ATR-Binning: Die Preisskala wird in dynamische „Bins“ (Zonen) unterteilt, die mithilfe des Average True Range (ATR) berechnet werden. Dies stellt sicher, dass sich die Heatmap intelligent sowohl an hochvolatile als auch an eng konsolidierende Märkte anpasst.
Automatisch ungültig werdende Liquiditätsniveaus: Wenn ein bestimmter Preis-Bin eine massive Menge an Volumen ansammelt, wird er zu einem „Liquiditätsniveau“. Der Indikator zeichnet eine durchgezogene Linie, die in die Zukunft reicht. Wenn der Preis dieses Niveau erfolgreich durchbricht, wird die Linie automatisch entfernt (ungültig gemacht).
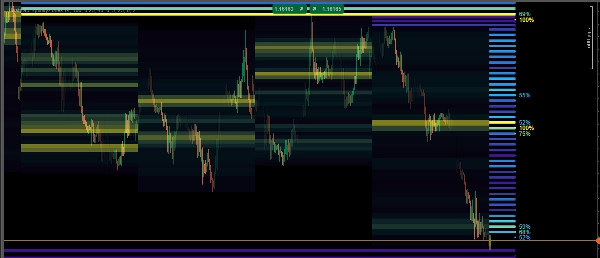
Dichte-Gradienten-Farbgebung: Unterscheiden Sie visuell zwischen niedrigen, mittleren und hohen Volumenknoten. Die Heatmap verwendet einen Farbverlauf, um Ihnen genau zu zeigen, wo das schwerste Volumen gefangen ist.
Prozentuale Verfolgung: Hochdichte-Liquiditätsniveaus zeigen ein Prozentetikett an (z. B. 85 %), das genau anzeigt, wie stark dieser Knoten im Verhältnis zum restlichen Volumen des HTF-Zeitraums ist.
Zusammenfassung
The indicator segments the price scale into dynamic zones based on the Average True Range (ATR), adapting to market volatility. It highlights significant volume clusters as liquidity levels with solid lines extending forward. These lines automatically disappear if the price breaks through the level, ensuring the chart remains focused on relevant, current price action.
A color gradient visually distinguishes low, medium, and high volume nodes, while percentage labels indicate the relative strength of high-density liquidity levels within the chosen timeframe. This tool supports traders in tracking market liquidity in real-time and making volume-backed decisions regarding support and resistance areas.
Kundenbewertungen
5 | 100 % | |
4 | 0 % | |
3 | 0 % | |
2 | 0 % | |
1 | 0 % |


