

Beschreibung
FIXED RANGE VOLUME PROFILE (FRVP)
Automatisch erkennender Volumenprofil-Indikator
--------------------------------------------------
Volumenverteilung. Wertbereiche. Hochvolumige Knotenpunkte. Alles von Ihrer Trendlinie.
--------------------------------------------------
WAS DIESER INDIKATOR TUT
Fixed Range Volume Profile (FRVP) zeigt die Volumenverteilung über einen benutzerdefinierten Bereich an — erkennt automatisch die zuletzt gezeichnete Trendlinie im Chart.
Keine manuelle Bereichsauswahl erforderlich. Zeichnen Sie einfach eine Trendlinie und das Profil erscheint.
--------------------------------------------------
HAUPTMERKMALE
- ERKENNT automatisch die neueste Trendlinie (keine manuelle Benennung erforderlich)
- Point of Control (POC) - höchstes Volumenniveau
- Wertbereich (VAH + VAL) - konfigurierbarer Prozentsatz (Standard 70%)
- Hochvolumige Knotenpunkte (HVN) - Volumen über dem Durchschnittsschwellenwert
- Histogrammanzeige (links oder rechts vom Bereich)
- Konfigurierbare Reihen (10 bis 200)
- Anpassbare Farben und Transparenz
- Linien nach rechts verlängern
- Preislabels anzeigen/verbergen
- Kein Neuzeichnen
--------------------------------------------------
WIE ES FUNKTIONIERT
1. Zeichnen Sie eine Trendlinie im Chart
2. Der Indikator erkennt sie automatisch
3. Das Volumenprofil wird aus dem Bereich berechnet
4. POC, VAH, VAL und HVN werden angezeigt
Keine Benennung erforderlich. Keine manuelle Bereichsauswahl.
--------------------------------------------------
VISUELLE ELEMENTE
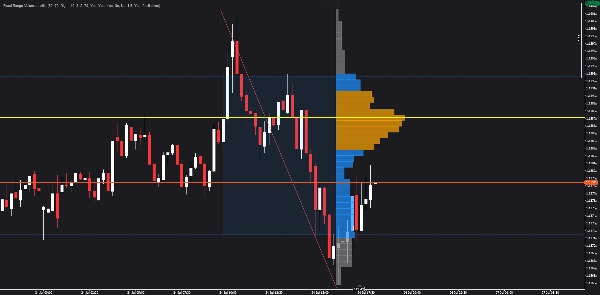
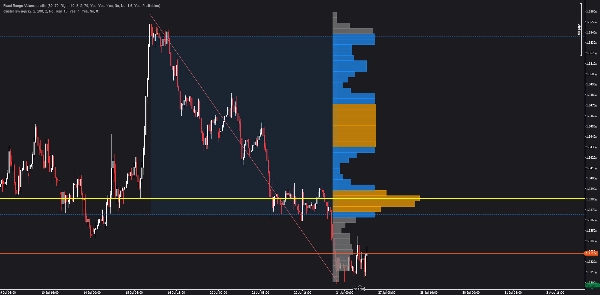
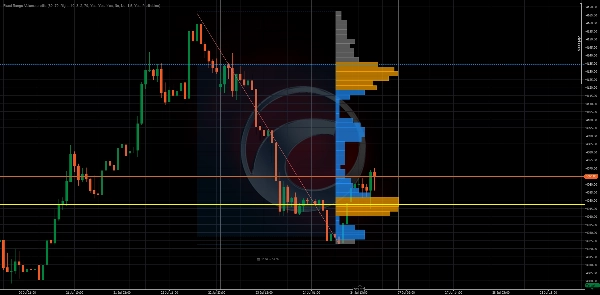
- Gelbe horizontale Linie = Point of Control (POC)
- Blaue gestrichelte Linien = Value Area High (VAH) und Value Area Low (VAL)
- Orange Balken = Hochvolumige Knotenpunkte (HVN)
- Graue Balken = Niedrigvolumige Knotenpunkte
- Schattierte Region = Wertbereich (70 % des Volumens)
- Histogramm = Volumenverteilung nach Preisniveau
--------------------------------------------------
PARAMETERÜBERSICHT
PROFIL-EINSTELLUNGEN:
- Anzahl der Reihen: Wie viele Preisreihen (10-200)
- Wertbereichsprozentsatz: % des Volumens im Wertbereich (1-100)
VISUELLE EINSTELLUNGEN:
- Profilseite: Links oder rechts vom Bereich
- Histogrammbreite %: Breite der Histogrammbalken
- Balkenbreiten-Skalierung: Skalierungsfaktor für Balkenbreiten
- Minimale Balkenbreite %: Minimale Balkenbreite
- Balken-Deckkraft: Transparenz der Balken (10-100)
FARBEN:
- POC-Farbe
- Wertbereichsfarbe
- Farbe für hochvolumige Knotenpunkte
- Farbe für niedriges Volumen
HOCHVOLUMIGE KNOTENPUNKTE:
- HVN-Schwellenwert: Volumenmultiplikator zur Qualifikation als HVN
TRENDLINIEN-EINSTELLUNGEN:
- Automatisch neueste erkennen: Findet automatisch die neueste Trendlinie
- Manueller Trendlinienname: Namen angeben (wenn automatische Erkennung aus)
--------------------------------------------------
ANWENDUNGSFÄLLE
- Erkennen, wo das meiste Volumen auftrat
- Point of Control (POC) für Ein- und Ausstiege finden
- Wertbereich (VAH/VAL) für Gewinnziele verwenden
- Hochvolumige Knotenpunkte (HVN) für Schlüsselbereiche erkennen
- Volumenverteilung auf einen Blick verstehen
- Mit anderen Indikatoren für Übereinstimmung kombinieren
--------------------------------------------------
UPGRADE ZU STRUCTURAL HEAT ZONES
Dieser Indikator zeigt Ihnen die Volumenverteilung.
Structural Heat Zones gehen weiter — sie kartieren Teilnahmeintensität, Akzeptanz vs. Ablehnung und Marktbeteiligung über mehrere Zonen hinweg.
Suchen Sie im cTrader Store nach Structural Heat Zones.
--------------------------------------------------
UPGRADE ZU INVICTUS EA
Invictus EA nutzt strukturelle Technologie, um automatisierte Trades auszuführen.
Suchen Sie im cTrader Store nach Invictus.
--------------------------------------------------
TECHNISCHE HINWEISE
- Overlay-Indikator
- Funktioniert auf jedem Zeitrahmen und Symbol
- Kein Neuzeichnen (historische Berechnung)
- Für Leistung optimiert
--------------------------------------------------
SUPPORT
Lebenslange Updates inklusive.
FÜR WEITERE INFORMATIONEN - Klicken Sie unten auf das Entwicklerprofil.





























![„High-Low Divergence [Iridio Capital]“-Logo](https://cdn.ctrader.com/image/webp/10a9e91b-243a-43f6-bbfe-7376bad5a214_61554)