

Description
SWING VOLUME PROFILE (SVP)
Swing-Based Volume Profile + Fibonacci + RSI
--------------------------------------------------
Swing detection. Volume profile. Fibonacci. RSI. All-in-one.
--------------------------------------------------
WHAT THIS INDICATOR DOES
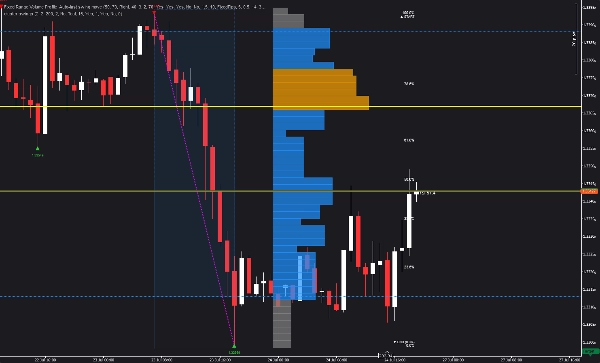
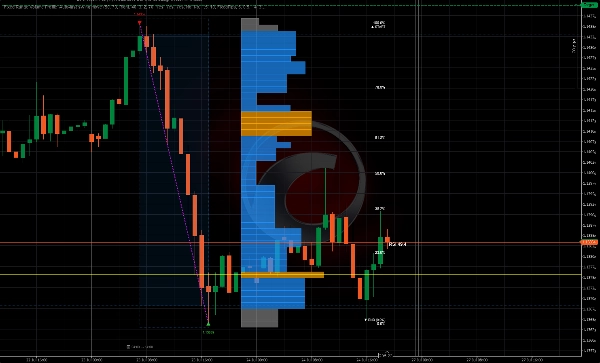
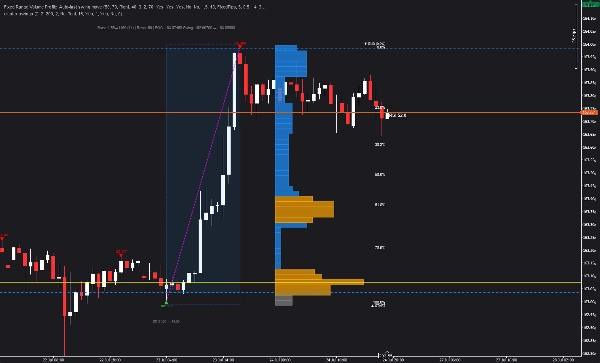
Swing Volume Profile (SVP) automatically detects structural swings and displays a volume profile for the most recent completed swing — with Fibonacci retracement and RSI overlay.
No manual range selection needed. The indicator finds the swings and builds the profile automatically.
--------------------------------------------------
KEY FEATURES
- AUTO-SWING DETECTION (configurable depth and deviation)
- Volume Profile for the last completed swing
- Point of Control (POC) - highest volume level
- Value Area (VAH + VAL) - configurable percentage
- High Volume Nodes (HVN) - volume above average threshold
- Fibonacci Retracement (0, 23.6, 38.2, 50, 61.8, 78.6, 100)
- RSI Overlay near current price
- Histogram positioning: Left, Right, or Near Bars
- Configurable rows (10 to 200)
- Customizable colors and opacity
- Extend lines to the right
- Show/hide price labels
- No repainting
--------------------------------------------------
HOW IT WORKS
1. The indicator detects swings using configurable depth and deviation
2. The last completed swing is identified
3. Volume profile is calculated from the swing range
4. POC, VAH, VAL, HVN are displayed
5. Fibonacci retracement is overlaid on the swing
6. Current RSI is displayed near price
All automatic. No manual input required.
--------------------------------------------------
VISUAL ELEMENTS
- Red down triangles = Swing highs
- Green up triangles = Swing lows
- Magenta dotted line = Swing connection
- Yellow horizontal line = Point of Control (POC)
- Blue dashed lines = Value Area High (VAH) and Value Area Low (VAL)
- Orange bars = High Volume Nodes (HVN)
- Gray bars = Low volume nodes
- Gold horizontal lines = Fibonacci levels
- White labels = Fibonacci percentages
- RSI value = Current RSI near price
--------------------------------------------------
PARAMETER OVERVIEW
PROFILE SETTINGS:
- Number of Rows: How many price rows (10-200)
- Value Area Percentage: % of volume in value area (1-100)
VISUAL SETTINGS:
- Histogram Position: Right, Left, Near Bars, or Near Bars Left
- Histogram Width %: Width of histogram bars
- Bar Width Scaling: Scaling factor for bar widths
- Min Bar Width %: Minimum bar width
- Bar Opacity: Transparency of bars (10-100)
SWING DETECTION:
- Swing Depth: How many bars to check for local extrema
- Deviation Mode: Fixed Pips or ATR-Based
- Fixed Deviation: Minimum pip distance between swings
- ATR Deviation Multiplier: Multiplier for ATR-based deviation
- ATR Period: Period for ATR calculation
- Backstep: Minimum bars between swings
VISUAL - SWINGS:
- Show Swing Lines: Toggle magenta swing line
- Swing Line Color
- Show Swing Labels: Toggle price labels
- High/Low Swing Colors
VISUAL - FIBONACCI:
- Show Fib Retracement: Toggle Fibonacci overlay
- Show Fib Lines: Toggle horizontal lines
- Show Fib Labels: Toggle percentage labels
- Fib Line Color / Fib Text Color
VISUAL - RSI:
- Show RSI Value: Toggle RSI overlay
- RSI Period: Period for RSI calculation
- RSI Label Color
COLORS:
- POC Color / Value Area Color / High Volume Node Color / Low Volume Color
--------------------------------------------------
USE CASES
- Identify swings and volume distribution in one view
- Find Point of Control (POC) for entries and exits
- Use Value Area (VAH/VAL) for profit targets
- Spot High Volume Nodes (HVN) for key levels
- Apply Fibonacci retracement to the swing
- Confirm trades with RSI confluence
- Understand volume distribution at a glance
--------------------------------------------------
UPGRADE TO STRUCTURAL HEAT ZONES
This indicator shows you swings and volume distribution.
Structural Heat Zones takes it further — it maps participation intensity, acceptance vs rejection, and market engagement across multiple zones.
Search for Structural Heat Zones in the cTrader Store.
--------------------------------------------------
UPGRADE TO INVICTUS EA
Invictus EA uses structural technology to execute automated trades.
Search for Invictus in the cTrader Store.
--------------------------------------------------
TECHNICAL NOTES
- Overlay indicator
- Works on any timeframe and symbol
- No repainting (historical calculation)
- Optimized for performance
--------------------------------------------------
SUPPORT
Lifetime updates included.
FOR MORE INFORMATION - Click Developer's Profile below.
Summary
The indicator identifies swings using configurable parameters such as swing depth and deviation mode (fixed pips or ATR-based), then computes volume distribution within the swing range without requiring manual range selection. Visual elements include colored markers for swing highs and lows, volume nodes, Fibonacci levels, and RSI values, all customizable in terms of color, opacity, and histogram positioning.
Key features include no repainting, configurable rows for volume profile resolution, extendable lines, and toggleable price labels. Use cases focus on identifying swing structures, volume distribution, key price levels, and confluences for trade entries, exits, and profit targets. The indicator is optimized for performance and provides lifetime updates.




























