Description
SWING HIGHS LOWS DETECTOR
Swing Detection with Divergence Analysis
--------------------------------------------------
Identify swings. Spot divergences. Trade with confluence.
--------------------------------------------------
WHAT THIS INDICATOR DOES
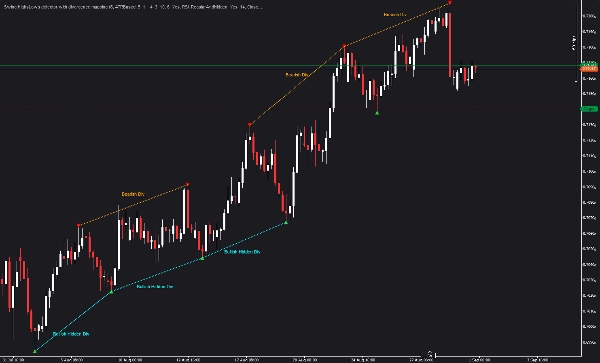
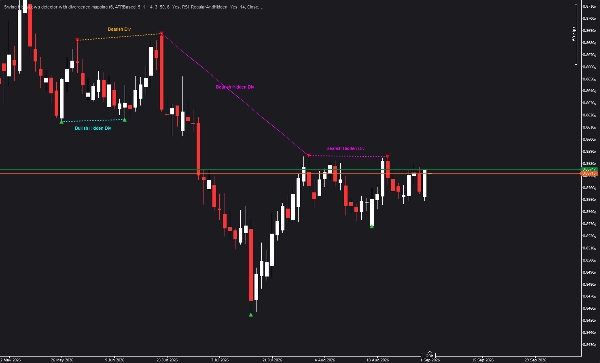
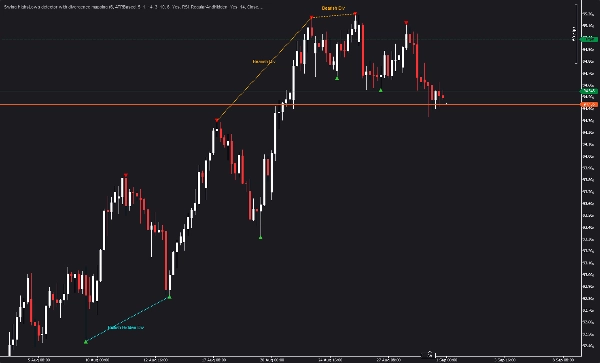
This indicator automatically detects structural swing highs and lows using configurable depth and deviation filtering. It then analyzes RSI and MACD to detect regular and hidden divergences between consecutive swings of the same type.
Divergences are powerful reversal signals. Regular divergence indicates a potential trend reversal, while hidden divergence indicates a potential trend continuation. This indicator identifies both and displays them directly on your chart.
--------------------------------------------------
CORE LOGIC AND CALCULATION
The indicator detects swing points using a local extrema algorithm with configurable depth. Each swing point is validated against a deviation threshold, ensuring only significant swings are displayed. The deviation can be fixed in pips or adaptive to volatility using ATR.
Once swings are identified, the indicator computes RSI and MACD values at each swing point. It then compares consecutive swings of the same type (high to high, low to low) to detect regular and hidden divergences. Regular divergence occurs when price makes a higher high but RSI/MACD makes a lower high (bearish) or price makes a lower low but RSI/MACD makes a higher low (bullish). Hidden divergence occurs when price makes a lower high but RSI/MACD makes a higher high (bearish) or price makes a higher low but RSI/MACD makes a lower low (bullish).
The divergence source can be selected as RSI, MACD, or both. The divergence type can be regular only, hidden only, or both. Unconfirmed swings can be included in divergence detection, providing earlier signals.
The current swing state machine tracks unconfirmed swings (U) that are still forming. These swings appear in yellow and can be promoted to confirmed or invalidated as price action develops.
--------------------------------------------------
KEY FEATURES
- AUTOMATIC SWING DETECTION: Identifies swing highs and lows using configurable depth and deviation filtering.
- REGULAR DIVERGENCE DETECTION: Identifies classic divergence signals indicating potential trend reversal.
- HIDDEN DIVERGENCE DETECTION: Identifies hidden divergence signals indicating potential trend continuation.
- RSI AND MACD DIVERGENCE: Choose RSI, MACD, or both as the divergence source.
- CONFIGURABLE DEVIATION: Fixed pips or ATR-based deviation adapts to market volatility.
- UNCONFIRMED SWING TRACKING: Shows potential swings (U) while they are still forming.
- LOOKBACK CONTROL: Limit the number of swing points displayed for performance optimization.
- CUSTOMIZABLE COLORS: Separate colors for confirmed highs, confirmed lows, unconfirmed swings, and divergence types.
- NO REPAINTING: All calculations are based on historical data.
--------------------------------------------------
PARAMETER GUIDE
SWING SETTINGS
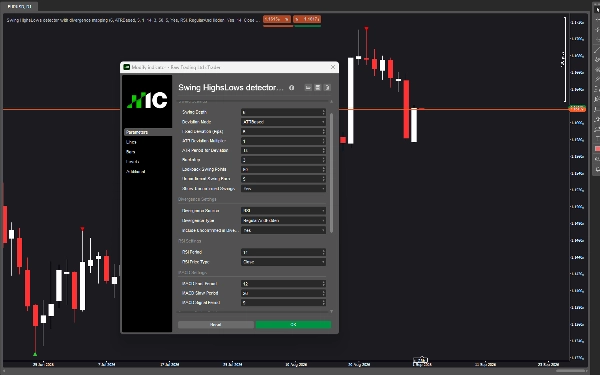
Swing Depth: This parameter controls how many bars are checked on each side of a bar to determine if it is a swing high or low. Higher values produce fewer, more significant swings. Lower values produce more swings. The default is 10. For lower timeframes such as M5 and M15, consider using 6 to 8. For higher timeframes such as H4 and above, consider using 12 to 16.
Deviation Mode: This parameter selects between Fixed Pips and ATR-Based deviation. Fixed Pips uses a constant minimum price distance between swings. ATR-Based adapts to volatility, using a multiplier of the current ATR value. The default is Fixed Pips.
Fixed Deviation (Pips): When using Fixed Pips mode, this parameter sets the minimum pip distance between consecutive swings. The default is 5.0. Increase this value to filter out smaller swings and focus on larger structural moves. Decrease to capture more swings.
ATR Deviation Multiplier: When using ATR-Based mode, this parameter multiplies the current ATR value to determine the minimum deviation. The default is 0.5. Higher values produce fewer swings. Lower values produce more swings.
ATR Period for Deviation: When using ATR-Based mode, this parameter sets the period for ATR calculation. The default is 14. Shorter periods produce more responsive ATR values. Longer periods produce smoother values.
Backstep: This parameter sets the minimum number of bars between swings. The default is 3. Increase this value to prevent swings from appearing too close together. Decrease to allow more frequent swings.
Lookback Swing Points: This parameter limits the number of swing points displayed for performance optimization. The default is 50. Increase for more historical context. Decrease for faster performance on slower machines.
Unconfirmed Swing Bars: This parameter sets how many bars after a potential swing the indicator looks for a better candidate. The default is 3. Higher values allow more time for a better swing to form. Lower values produce faster signals.
Show Unconfirmed Swings: When enabled, potential swings (U) are displayed in yellow before they are confirmed. The default is true. Disable for a cleaner chart showing only confirmed swings.
DIVERGENCE SETTINGS
Divergence Source: This parameter selects the indicator used for divergence detection. Options are RSI, MACD, or RSIAndMACD. RSIAndMACD requires both indicators to show divergence for a signal to be generated. The default is RSI.
Divergence Type: This parameter selects which divergence types to detect. Options are RegularOnly, HiddenOnly, or RegularAndHidden. The default is RegularAndHidden.
Include Unconfirmed in Divergence: When enabled, unconfirmed swings can be used as the current swing in divergence detection. The default is true. Disable to require both swings to be fully confirmed before divergence is displayed.
RSI SETTINGS
RSI Period: This parameter sets the period for RSI calculation. The default is 14. Standard values range from 9 to 25. Shorter periods produce more sensitive RSI values. Longer periods produce smoother values.
RSI Price Type: This parameter selects the price series used for RSI calculation. Options include Close, Open, High, Low, Typical, Median, and Weighted. The default is Close.
MACD SETTINGS
MACD Fast Period: This parameter sets the fast EMA period for MACD calculation. The default is 12.
MACD Slow Period: This parameter sets the slow EMA period for MACD calculation. The default is 26.
MACD Signal Period: This parameter sets the signal line period for MACD calculation. The default is 9.
VISUALS
High Swing Color: Color for confirmed swing highs. Default is Red.
Low Swing Color: Color for confirmed swing lows. Default is LimeGreen.
Unconfirmed High Swing Color: Color for unconfirmed swing highs (U). Default is Yellow.
Unconfirmed Low Swing Color: Color for unconfirmed swing lows (U). Default is Yellow.
Bullish Regular Divergence Color: Color for bullish regular divergence lines. Default is DodgerBlue.
Bearish Regular Divergence Color: Color for bearish regular divergence lines. Default is Orange.
Bullish Hidden Divergence Color: Color for bullish hidden divergence lines. Default is Cyan.
Bearish Hidden Divergence Color: Color for bearish hidden divergence lines. Default is Magenta.
Show Labels: When enabled, divergence labels are displayed on the chart. The default is true.
Label Font Size: This parameter sets the font size for divergence labels. The default is 8.
Divergence Label Offset (Pips): This parameter controls how far the divergence label is offset from the divergence line. The default is 10.
--------------------------------------------------
USE CASES
- Identify structural swing highs and lows for market structure analysis
- Detect regular divergences for potential reversal signals
- Detect hidden divergences for potential trend continuation signals
- Combine divergence signals with price action for higher probability trades
- Use RSI and MACD divergence confirmation for entry and exit decisions
- Track unconfirmed swings for early signal detection
--------------------------------------------------
RECOMMENDED WORKFLOW
Step 1: Attach the indicator to your chart with default settings.
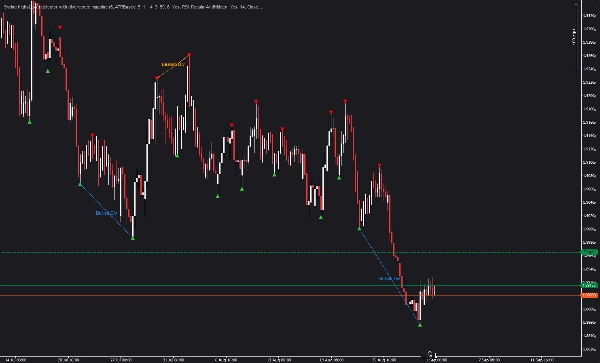
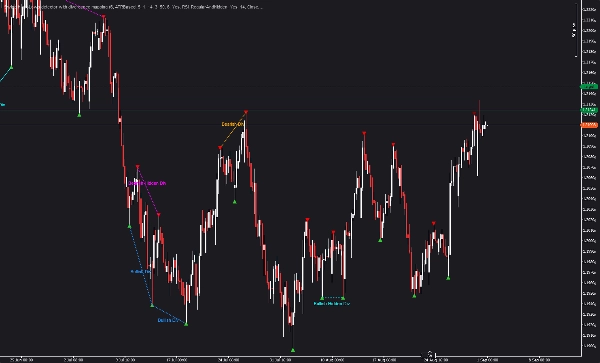
Step 2: Identify confirmed swing highs and lows (red and green triangles).
Step 3: Look for divergence lines (blue, orange, cyan, magenta) connecting consecutive swings.
Step 4: Interpret regular divergences as potential reversals and hidden divergences as potential continuations.
Step 5: Confirm divergence signals with price action or other indicators before entering trades.
--------------------------------------------------
TECHNICAL NOTES
- Overlay indicator that draws directly on the price chart
- Works on any timeframe and symbol
- Configurable swing detection and divergence parameters
- No repainting; all calculations are based on historical data
- Optimized for performance with lookback control
- Compatible with cTrader
--------------------------------------------------
SUPPORT
Lifetime updates included.
FOR MORE INFORMATION - Click Developer's Profile below.