Description
Pivot Levels: sessions, previous day and week, ORB, Floor Pivot and Camarilla
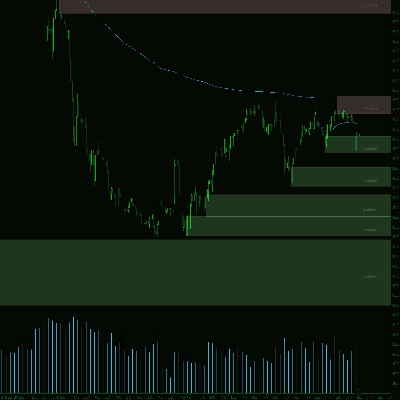
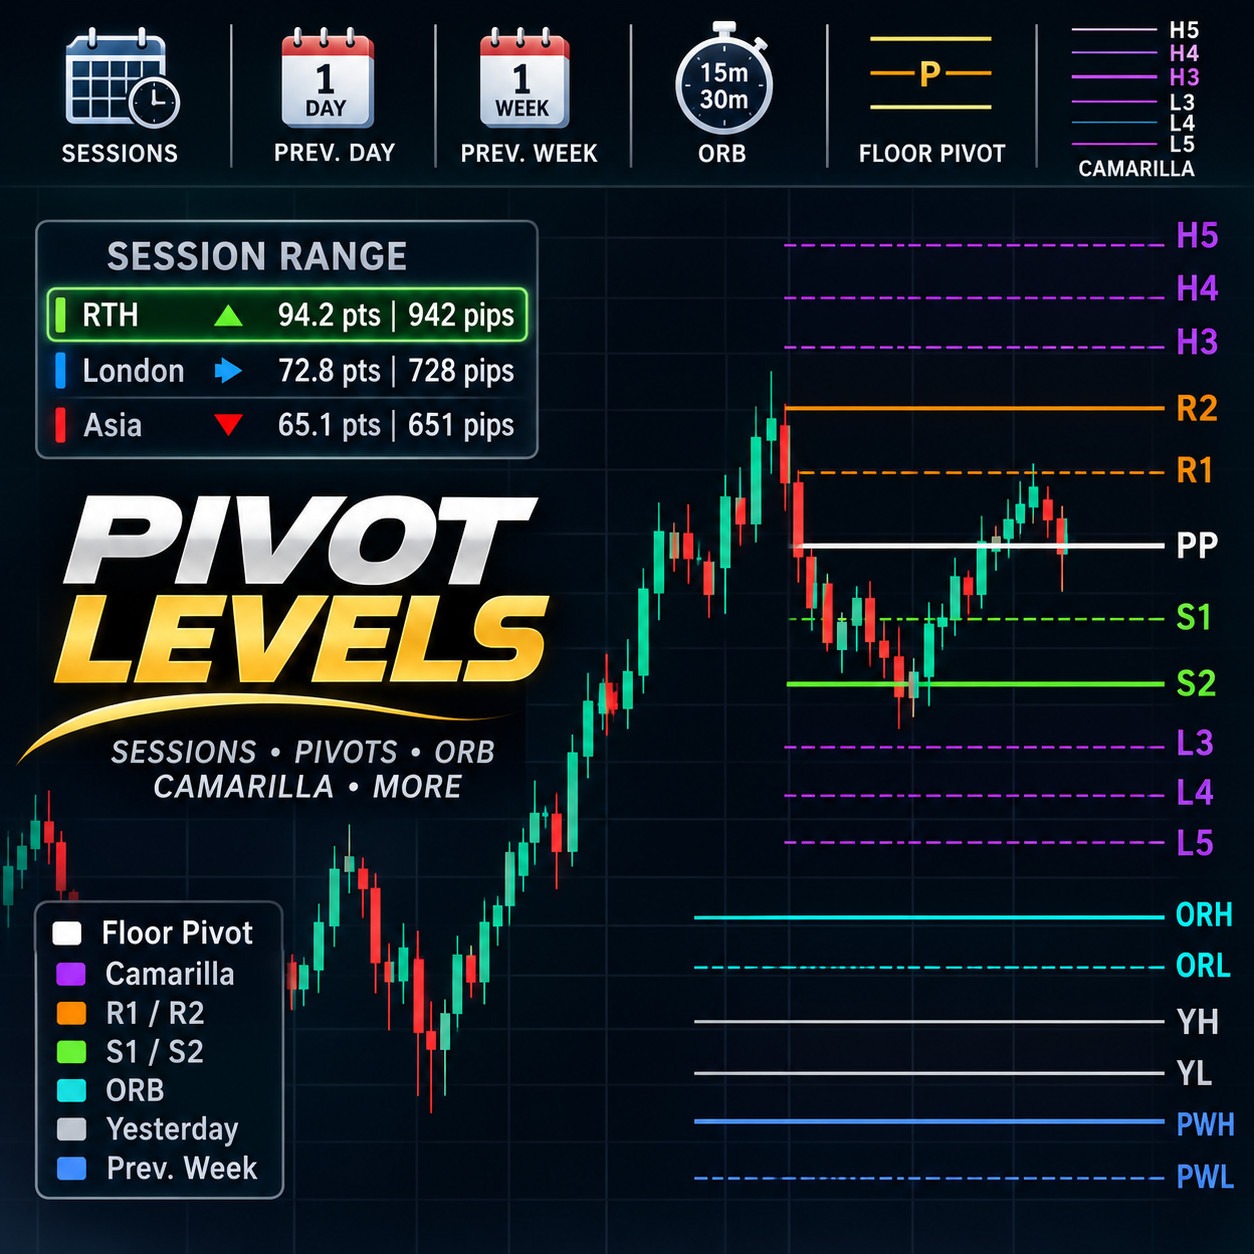
Pivot Levels puts the price levels that traders watch every day on your chart, drawn as clean rays with labels, and adds a compact table with the range of each session. It is a display-only study: it places no orders and changes nothing on your account.
What it draws
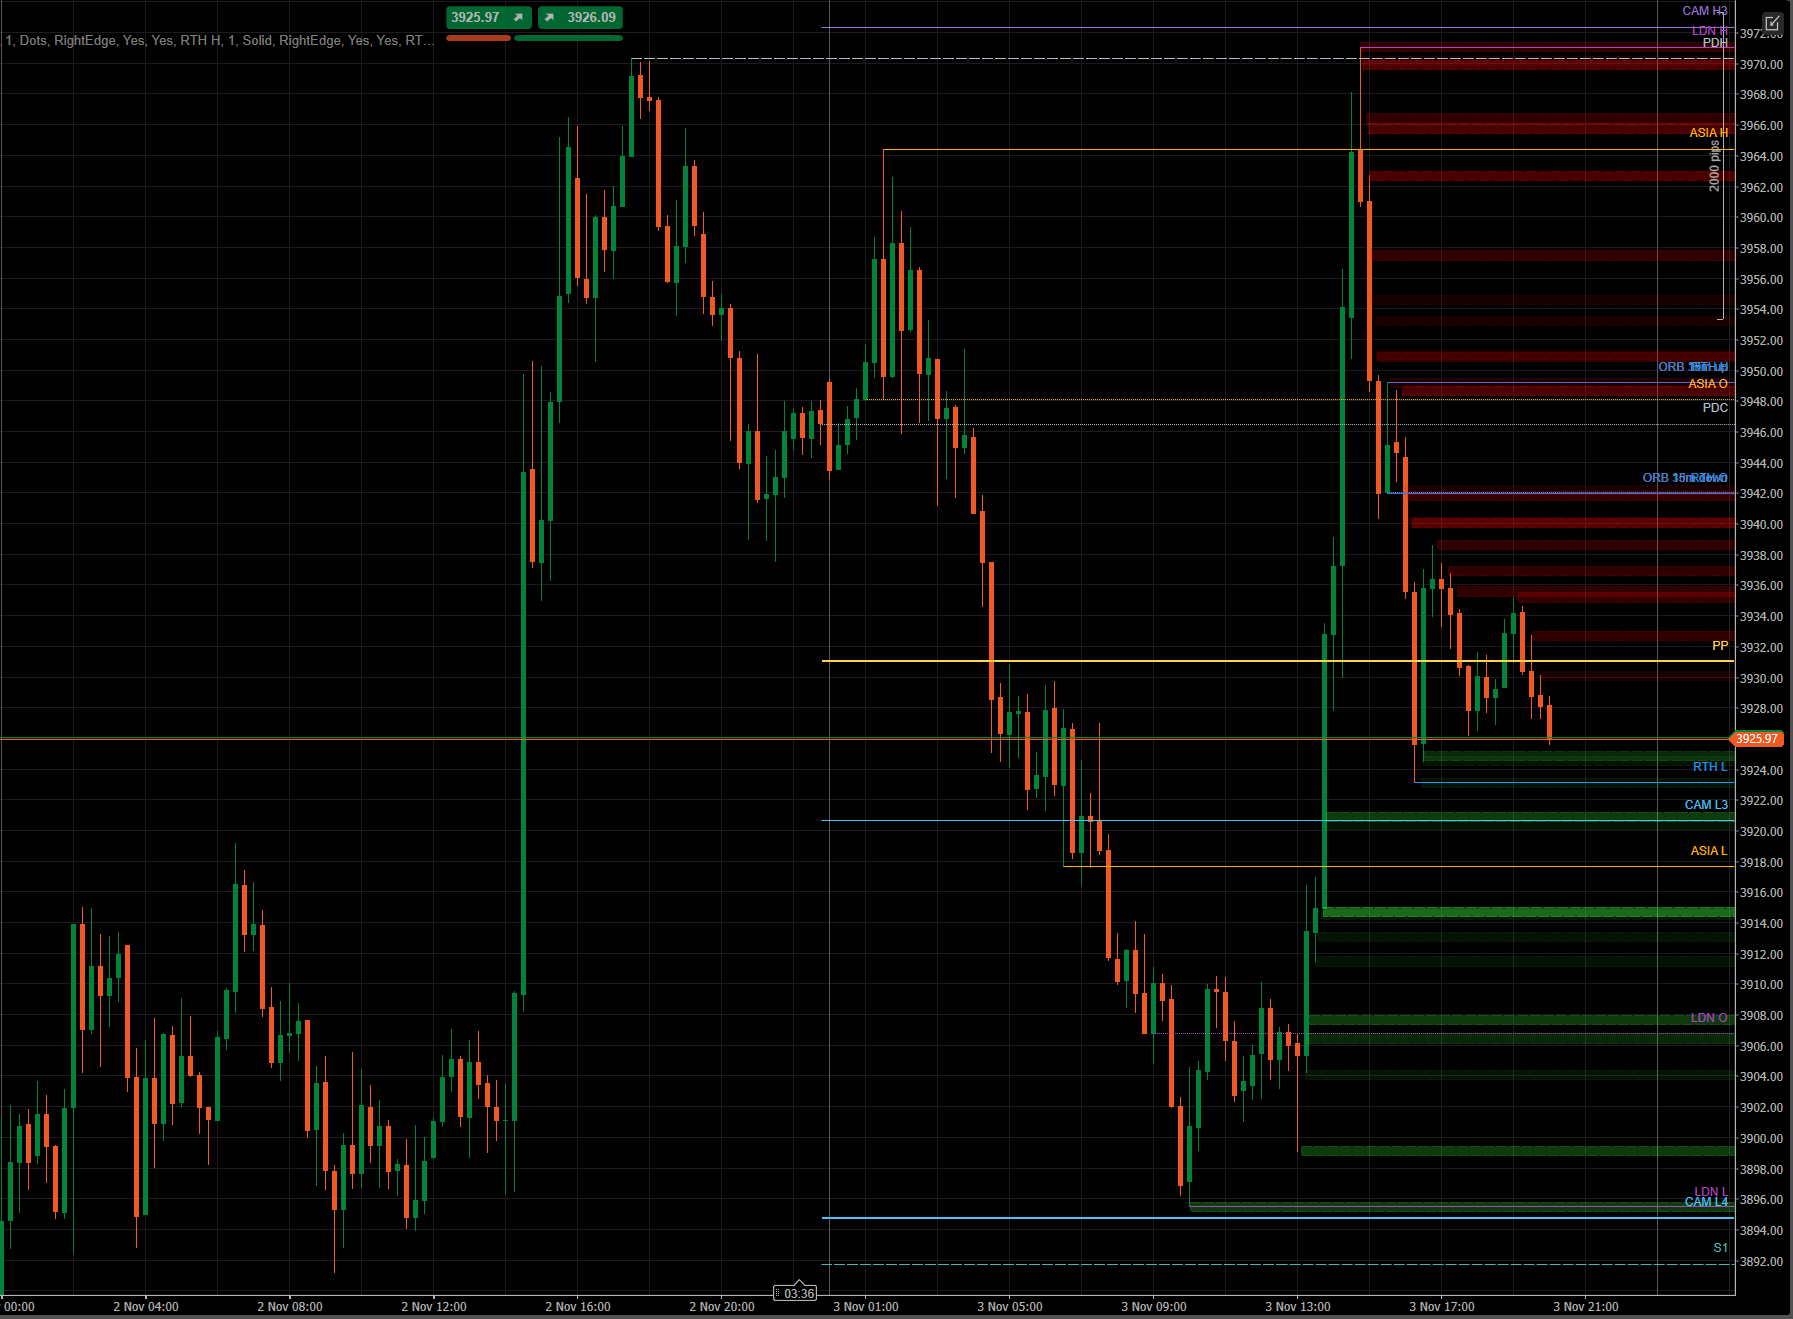
- Today's sessions: Open, High and Low of the RTH session (09:30–16:00 New York), the Asian session (Tokyo) and the London session. Session times follow their own time zones, so daylight saving is handled for you, and you don't type any hours
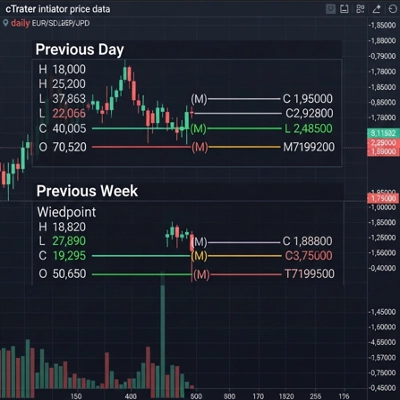
- Yesterday: Open, High, Low and Close of the previous trading day
- Previous week: Open, High, Low and Close of the previous week.
- Opening Range Breakout (ORB): the high ("up") and low ("down") reached in the first 15 and 30 minutes of the RTH session. Draw them only once the range has formed, or in real time while it forms
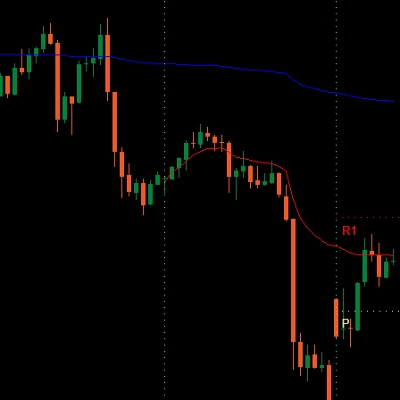
- Floor Pivot: PP, R1, R2, S1, S2, calculated from the previous trading day
- Camarilla: H3, H4, H5, L3, L4, L5, calculated from the previous trading day
Each line starts where its value was formed (the time of the high, the low or the open), so you can see when a level was set. Current levels extend to the right as rays. Past days can optionally be shown for review.
Session Range Monitor
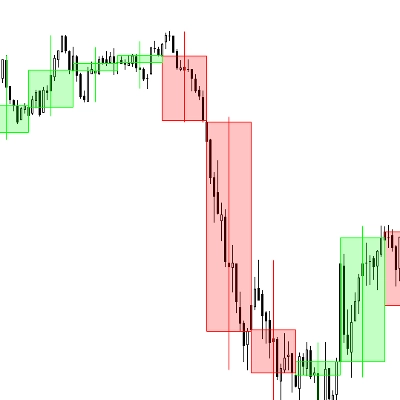
A small table shows, for each session of the current trading day, its range in points and pips and an arrow for the direction of the session. The live session is highlighted. You choose the corner, the offsets and the font size.
Trading day without setup
By default the trading day is taken from your broker's own Daily bars, so rollover and daylight saving are the real ones for your server and nothing needs to be configured.
Alternatively you can use a fixed 17:00 New York day, identical across brokers. You can also compute yesterday, weekly and pivot levels on the full session or on RTH only.
Customization
- Every level has its own switch, label, line width, line style, color (with the native color picker), label side and optional price value
- Label position: left, right (follows the last bar), or anchored to the right or left edge of the chart, next to the Y axis, even while you scroll or zoom
- A general switch to show labels only, or labels with values, and a label font size
- History loads in the background, so the chart stays responsive. The data timeframe is chosen automatically from your chart and can be changed
Good to know
- Works on any symbol and chart timeframe supported by your CFD broker's data since all levels are derived from price only
- Levels are calculated from the data your broker provides, so values can differ slightly between brokers
- This is an analysis tool, not trading advice. Past levels do not guarantee future price behavior