
Description
🚀 SUPERTREND TP PRO
Complete trade plans from the Supertrend: Entry, 3 Take Profits, Stop Loss and live statistics.
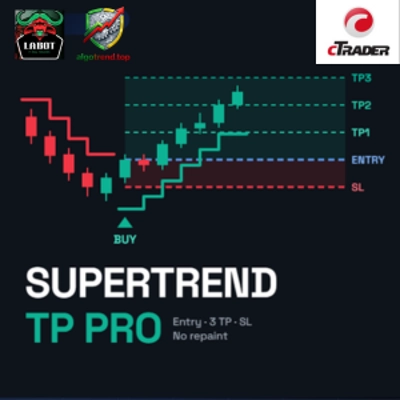
Supertrend TP Pro turns the classic ATR Supertrend into a full trading assistant for cTrader. Every time the trend flips, it draws a ready-made trade plan on the chart: entry price, ATR-based stop loss and three take-profit targets at the risk/reward you choose.
Signals are confirmed at bar close, so they never repaint. On top of that, the indicator measures trend strength with ADX, checks the trend on 5 timeframes at once and keeps a live record of how its setups performed on your chart.
✨ KEY FEATURES
✅ Supertrend line with trend-colored area and optional candle coloring
✅ BUY and SELL signals confirmed at bar close, no repaint
✅ Automatic Entry, TP1, TP2, TP3 and SL with price labels and colored profit/loss zones
✅ TP reached markers on the chart and popup alerts for signals and take profits
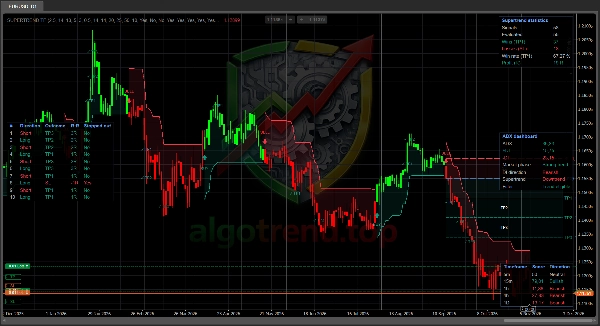
✅ Statistics panel: signals, wins at TP1, losses at SL, win rate and total profit in R
✅ Trade history of the last 10 setups with outcome and R:R
✅ ADX dashboard: market phase (Range, Transition, Strong trend), +DI, -DI and trend filter status
✅ Multi-timeframe dashboard: trend score 0 to 100 on 5m, 15m, 1h, 4h and 1D
✅ Optional filters: minimum ADX for signals and EMA 200 direction filter
✅ Optional re-entry signals after TP3: Supertrend pullback, EMA pullback or aggressive EMA touch
✅ Optional structure tools: diagonal trendlines, automatic trend channel, breakout signals, key support and resistance levels
✅ Fully customizable colors, levels and panels
🇬🇧 Quick start guide (English)
📘 HOW TO USE IT
1️⃣ Add it to the chart
→ Open any chart, any symbol, any timeframe, and add Supertrend TP Pro from the Indicators menu.
2️⃣ Read the trend
→ Green Supertrend line below price = uptrend. Red line above price = downtrend. Candles and the shaded area follow the same colors.
3️⃣ Wait for the signal
→ A BUY arrow appears when the trend turns up, a SELL arrow when it turns down. Signals are confirmed at bar close, so once on the chart they stay there.
4️⃣ Use the trade plan
→ Entry = close of the signal bar
→ SL = Entry minus or plus ATR x Stop Loss ATR Multiplier (this distance is 1 R)
→ TP1, TP2, TP3 = risk distance x the Risk Reward you set
→ Exact prices are shown in the labels on the right.
5️⃣ Manage the trade
→ A ✓ TP marker appears when price reaches each target. A common approach: partial close at TP1, stop to break-even, let the rest run toward TP2 and TP3.
6️⃣ Check the context before entering
→ ADX dashboard: "Strong trend" and "Trend eligible" mean the Supertrend direction is backed by trend strength. "Range" means signals are more likely to fail.
→ Multi-timeframe dashboard: above 60 = bullish, below 40 = bearish, in between = neutral (default neutral zone 10). Trading with the higher timeframes filters out weak setups.
7️⃣ Review the statistics
→ The statistics panel and the trade history show how your settings performed on the loaded history. Adjust Factor, ATR Period or the TP ratios and compare before trading live.
8️⃣ Turn on alerts
→ With Popup Alerts on, you get a popup in cTrader for every confirmed signal and every take profit reached. The same message is written in the Log tab.
📊 HOW THE STATISTICS ARE COUNTED
🟢 Win → TP1 is reached. Adds the TP1 Risk Reward in R.
🔴 Loss → SL is hit before TP1. Subtracts 1 R.
⚪ REV → closed by an opposite signal before TP1 or SL. Shown in the history, not counted in the win rate.
⚠️ If TP1 and SL are touched in the same bar, the loss is counted (conservative).
⚠️ Statistics use the bars loaded on the chart. They are a backtest-style reference, not a guarantee of future results.
🇬🇧 Parameters (English)
⚙️ CALCULATION
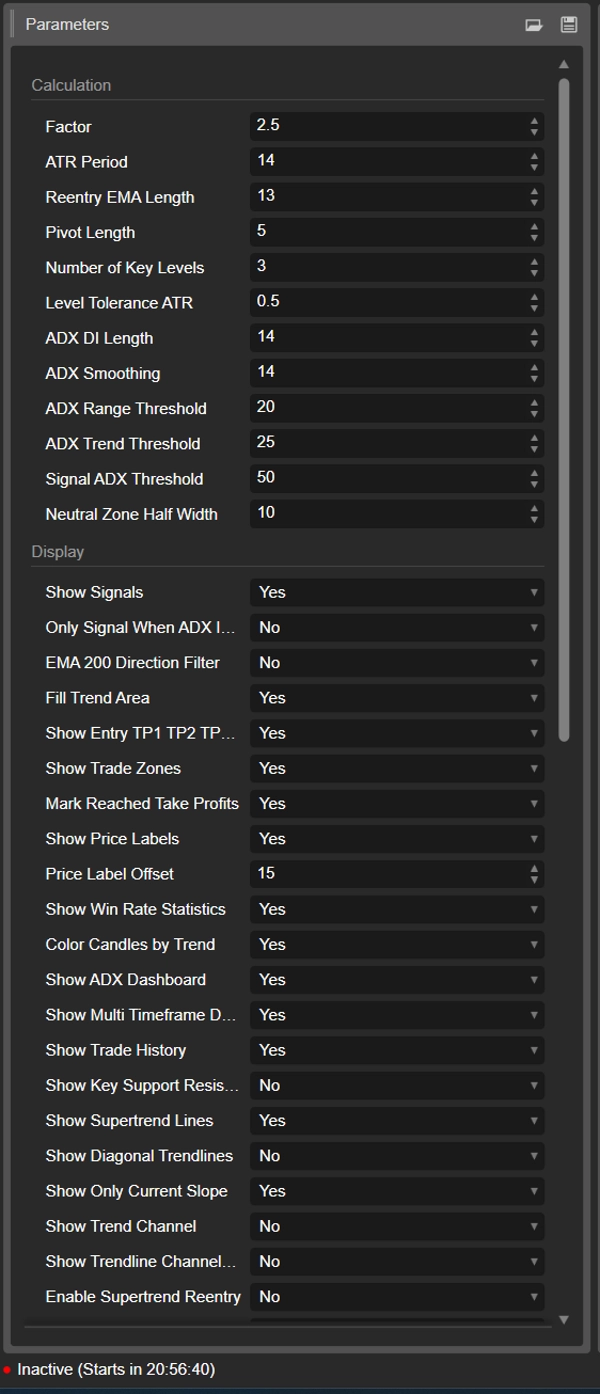
Factor (2.5) → ATR multiplier for the Supertrend distance. Higher = fewer, slower signals. Lower = more, faster signals.
ATR Period (14) → bars used for ATR. Drives both the Supertrend and the stop loss distance.
Reentry EMA Length (13) → EMA used by the EMA re-entry options after TP3. Recommended 13, 9 or 5.
Pivot Length (5) → bars on each side needed to confirm a swing high or low. Used by trendlines, channel, breakouts and key levels.
Number of Key Levels (3) → max support and resistance levels kept on each side, from 1 to 5.
Level Tolerance ATR (0.5) → pivots closer than this ATR distance are merged into one key level.
ADX DI Length (14) → length of +DI and -DI.
ADX Smoothing (14) → smoothing length of ADX.
ADX Range Threshold (20) → below this value the market is Range.
ADX Trend Threshold (25) → at or above this value the trend is Strong. Also used by the Filter row of the ADX dashboard.
Signal ADX Threshold (50) → minimum ADX for signals when Only Signal When ADX Is Strong is on.
Neutral Zone Half Width (10) → neutral zone around 50 in the multi-timeframe dashboard. Default: 40 to 60 = Neutral.
🖥️ DISPLAY
Show Signals (On) → BUY and SELL arrows.
Only Signal When ADX Is Strong (Off) → keeps only signals with ADX above Signal ADX Threshold.
EMA 200 Direction Filter (Off) → longs only above EMA 200, shorts only below. Also plots the EMA 200.
Fill Trend Area (On) → shades the area between price and the Supertrend line.
Show Entry TP1 TP2 TP3 and SL (On) → level lines of the latest setup.
Show Trade Zones (On) → colored profit and loss zones.
Mark Reached Take Profits (On) → marks each TP when price reaches it.
Show Price Labels (On) → exact prices next to the levels.
Price Label Offset (15) → how many bars to the right labels and levels extend.
Show Win Rate Statistics (On) → statistics panel, top right.
Color Candles by Trend (On) → candles colored by trend.
Show ADX Dashboard (On) → ADX panel, middle right.
Show Multi Timeframe Dashboard (On) → 5m, 15m, 1h, 4h, 1D panel, bottom right.
Show Trade History (On) → last 10 setups, middle left.
Show Key Support Resistance Levels (Off) → horizontal levels built from merged pivots.
Show Supertrend Lines (On) → Supertrend line and its fill.
Show Diagonal Trendlines (Off) → support and resistance trendlines through the last two pivots.
Show Only Current Slope (On) → uptrend: only rising support. Downtrend: only falling resistance. Also applies to the channel.
Show Trend Channel (Off) → automatic parallel channel from the latest pivots.
Show Trendline Channel Breakout Signals (Off) → adds BUY or SELL when a bar closes through a trendline or the channel.
Enable Supertrend Reentry (Off) → after TP3, signals a pullback that touches the Supertrend and closes back in the trend direction.
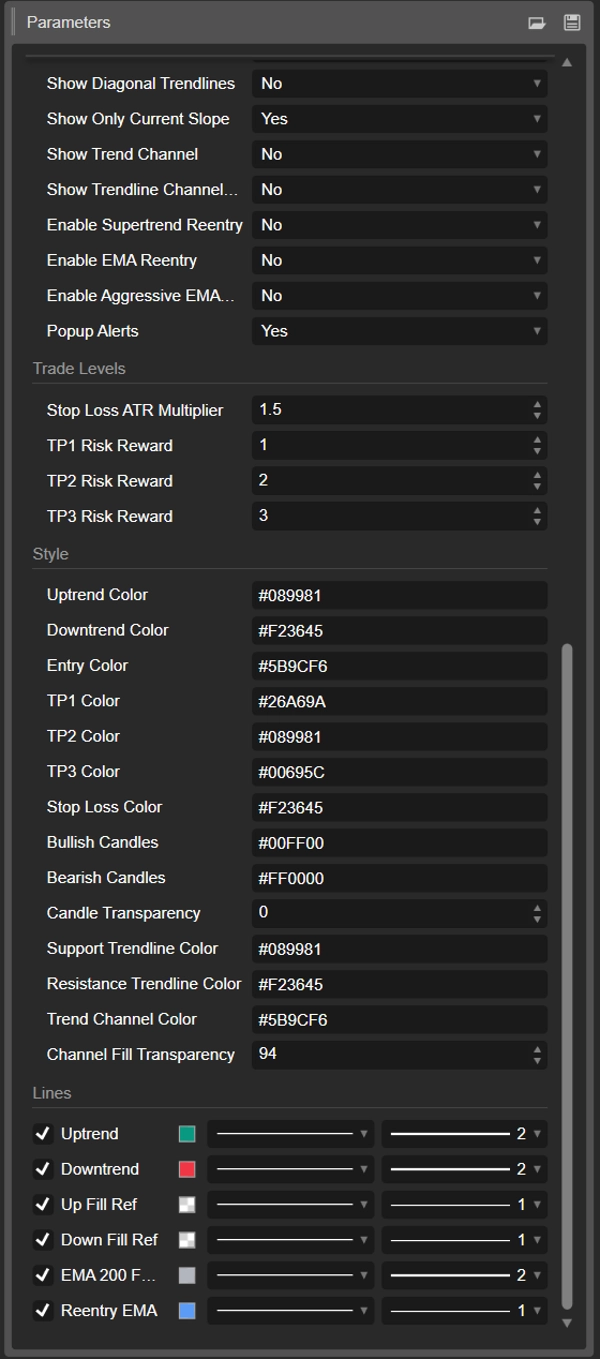
Enable EMA Reentry (Off) → after TP3, signals a close back across the re-entry EMA after a pullback across it.
Enable Aggressive EMA Reentry (Off) → after TP3, signals on a simple EMA touch with a close in the trend direction.
Popup Alerts (On) → popup and Log message for signals and TP hits, live only.
🎯 TRADE LEVELS
Stop Loss ATR Multiplier (1.5) → SL distance from Entry in ATR. This distance is 1 R.
TP1 Risk Reward (1.0) → TP1 at 1 x risk. Also the profit counted for each win in the statistics.
TP2 Risk Reward (2.0) → TP2 at 2 x risk.
TP3 Risk Reward (3.0) → TP3 at 3 x risk. Reaching TP3 arms the re-entry options.
🎨 STYLE
Uptrend Color / Downtrend Color (#089981 / #F23645) → colors of signals, panels and texts.
Entry, TP1, TP2, TP3, Stop Loss Color → color of each level, zone and label.
Bullish Candles / Bearish Candles (#00FF00 / #FF0000) → candle colors when candle coloring is on.
Candle Transparency (0) → 0 = solid, 100 = invisible.
Support / Resistance Trendline Color (#089981 / #F23645) → colors of trendlines and key levels.
Trend Channel Color (#5B9CF6) → channel line color.
Channel Fill Transparency (94) → transparency of the channel fill.
💡 Colors are typed as hex codes, for example #089981. Supertrend line color and thickness are set in the Lines section of the indicator settings.
🇬🇧 Tips, technical notes and disclaimer (English)
💡 TIPS
→ The Supertrend works best on trending markets (indices, gold, major FX pairs from H1 up). In tight ranges, use the ADX filter or wait for "Strong trend".
→ Start from the defaults, then tune Factor and ATR Period per symbol. Compare win rate and Profit in R, not the win rate alone.
→ Higher TP ratios lower the win rate but raise the profit per winning trade. Pick the balance that fits your management.
→ Use the multi-timeframe panel as a filter: BUY when 1h and 4h are Bullish, SELL when they are Bearish.
→ Load enough history for meaningful statistics: at least a few hundred bars, ideally more.
🔧 TECHNICAL NOTES
→ Signals, TP hits, statistics and history are evaluated on closed bars. Supertrend line, area and candle colors update live.
→ Level lines, zones and labels always show the latest setup only.
→ The multi-timeframe panel loads 5m, 15m, 1h, 4h and Daily bars of the same symbol.
→ No internet access or special permissions required.
⚠️ DISCLAIMER
This indicator is a technical analysis tool and does not place trades. Statistics are based on historical chart data and do not guarantee future results. Trading leveraged products carries a high risk of loss. Use proper risk management and test on a demo account first. Not financial advice.