Description
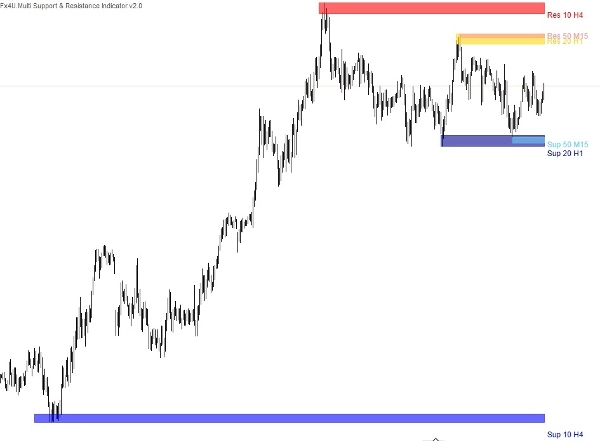
Multi-timeframe support and resistance indicators typically allow traders to visualize these levels across different timeframes, such as hourly, daily, weekly, or monthly charts. By incorporating multiple timeframes, traders can gain a broader perspective on where key price levels are located and how they may influence price action.
This type of indicator can help traders make more informed trading decisions by identifying significant support and resistance levels that may impact price movements over various timeframes. It can also help traders anticipate potential reversals or breakout opportunities when the price approaches these levels across multiple timeframes.
There are three types of support & resistance levels:
The three support and resistance indicators are built into this single indicator allowing you to plot your supply and demand zones on the chart with the following settings.
- Period value.
- Timeframe.
- The number of extremum – This is the number of current + past Support/Resistance points displayed. For example, if we choose 2, the indicator will select another Support and Resistance point in the past.
- Name and colour of the indicator.
Support and resistance levels that are significant on higher timeframes tend to carry more weight and by using a multi-timeframe indicator, traders can confirm the importance of a level if it appears consistently across multiple timeframes. This confirmation increases the reliability of the level and enhances traders’ confidence in their trading decisions.
My other products:
https://ctrader.com/products/346
https://ctrader.com/products/336
https://ctrader.com/products/343
https://ctrader.com/products/347
https://ctrader.com/products/147
Summary
The indicator consolidates three types of support and resistance levels into a single tool, allowing users to plot supply and demand zones with customizable settings such as period value, timeframe, the number of extremum points (current plus past support/resistance points), and indicator name and color. This multi-timeframe approach helps traders identify levels that carry more weight when confirmed across different timeframes, enhancing the reliability of these levels for decision-making.
By visualizing these critical zones, the indicator aids in anticipating potential price reversals or breakout opportunities. It supports a broader market overview, enabling more informed trading strategies based on the interaction of price with established support and resistance across various time horizons.
Customer reviews
5 | 33 % | |
4 | 67 % | |
3 | 0 % | |
2 | 0 % | |
1 | 0 % |
!["[Fx4U] GBPUSD - Price Action" logo](https://cdn.ctrader.com/image/webp/d80b34fc-da3c-4f01-a321-456450665649_26190)

!["[Fx4U] CADJPY - Price Action" logo](https://cdn.ctrader.com/image/webp/1ba81247-b6b7-4f3c-a297-fa3eb1d57fe1_26195)

!["[Fx4U] AUDCHF - Price Action" logo](https://cdn.ctrader.com/image/webp/0a22e9aa-c83b-42cd-b0b8-c1a2da593207_26148)

!["[Fx4U] EURAUD - Price Action" logo](https://cdn.ctrader.com/image/webp/baf8dde4-1ef3-4beb-8ae2-0fed8320f65d_26177)