
Description
The Pro Heikin Ashi Visual Overlay is the perfect tool for traders who want the trend-smoothing benefits of Heikin Ashi candles while keeping their standard candlestick or bar charts active.
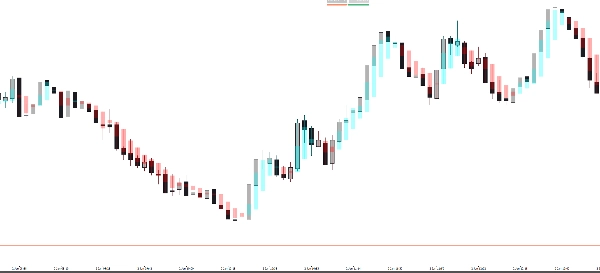
Traditional Heikin Ashi charts require you to switch the entire chart type, making it hard to see exact price action. This indicator solves that by drawing Heikin Ashi candles as a semi-transparent overlay, allowing you to spot trend reversals and market momentum instantly without losing sight of the real price.
Why use this Overlay?
- 💎 Noise Reduction: Heikin Ashi filters out market noise, making it easier to stay in winning trades.
- 🕯️ Dual-Chart View: Keep your standard candles for price action/patterns while using the HA overlay for trend direction.
- 🎨 Fully Customizable: Adjust opacity and colors to match your workspace (Dark or Light mode).
- 🚀 Instant Trend Identification: Blue (Bullish) and Red (Bearish) zones help you avoid trading against the momentum.
Key Features:
- Smart Transparency: Set the opacity so the overlay doesn't hide your main price action.
- Perfect Alignment: Calculated in real-time to match the current timeframe’s Heikin Ashi values.
- Professional Design: Clean visuals that don't clutter your chart.
- Universal: Works on all timeframes (M1 to Monthly) and all assets (Forex, Stocks, Crypto, Indices).
How to use it:
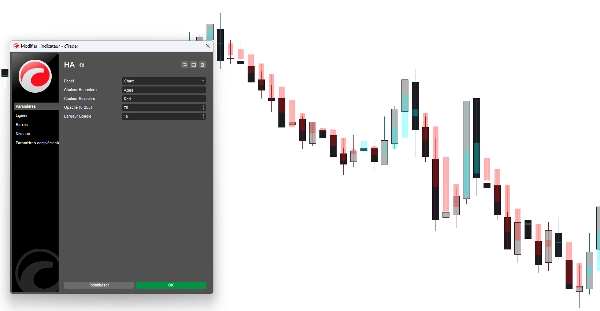
- Apply the indicator to your chart.
- Adjust the Opacity and Body Width in the settings to your preference.
- Use the HA candles to confirm trend strength:
- Long wicks in trend direction = Strong Momentum.
- Small bodies with wicks on both sides = Potential Reversal.
Parameters:
- Bullish Color: Custom color for upward HA candles.
- Bearish Color: Custom color for downward HA candles.
- Opacity (0-255): Control how "ghost-like" or solid the candles appear.
- Candle Width: Adjust the thickness of the HA candles to perfectly fit your zoom level.
Summary
AI summary
The Pro Heikin Ashi Visual Overlay is an indicator designed to enhance trend analysis by overlaying Heikin Ashi candles on standard candlestick or bar charts. Unlike traditional Heikin Ashi charts that replace the entire chart type, this tool provides a semi-transparent overlay, allowing traders to observe smoothed trend signals while retaining visibility of actual price action.
Key features include noise reduction to filter market fluctuations, customizable opacity and colors for integration with different chart backgrounds, and real-time alignment with the current timeframe’s Heikin Ashi calculations. The overlay uses blue and red zones to indicate bullish and bearish trends, aiding in immediate trend identification. It supports all timeframes from one minute to monthly and is compatible with various asset classes including Forex, stocks, cryptocurrencies, commodities, and indices.
Users can adjust candle width and opacity to suit their chart zoom level and visual preferences. The indicator facilitates dual-chart viewing, enabling simultaneous analysis of precise price patterns and smoothed trend momentum. It is designed with clean visuals to avoid chart clutter and supports professional trading environments.
Indicator profile
Customer reviews
4.0
Reviews: 1
5 | 0 % | |
4 | 100 % | |
3 | 0 % | |
2 | 0 % | |
1 | 0 % |
Discussion
FAQ
Forex
Signal
Indices
Commodities
Crypto
Stocks
Products available through cTrader Store, including trading bots, indicators and plugins, are provided by third-party developers and made available for informational and technical access purposes only. cTrader Store is not a broker and does not provide investment advice, personal recommendations or any guarantee of future performance.
More from this author


!["[Hamster-Coder] Pivot Points MTF" logo](https://cdn.ctrader.com/image/webp/4c143e5a-309c-40e3-a578-f04d1e133ffa_31159)


Price
Since 27/10/2025
10
Sales